> ## Documentation Index
> Fetch the complete documentation index at: https://enrolla-nk-hub-guardrails.mintlify.site/llms.txt
> Use this file to discover all available pages before exploring further.
# LLM Observability with Traceloop
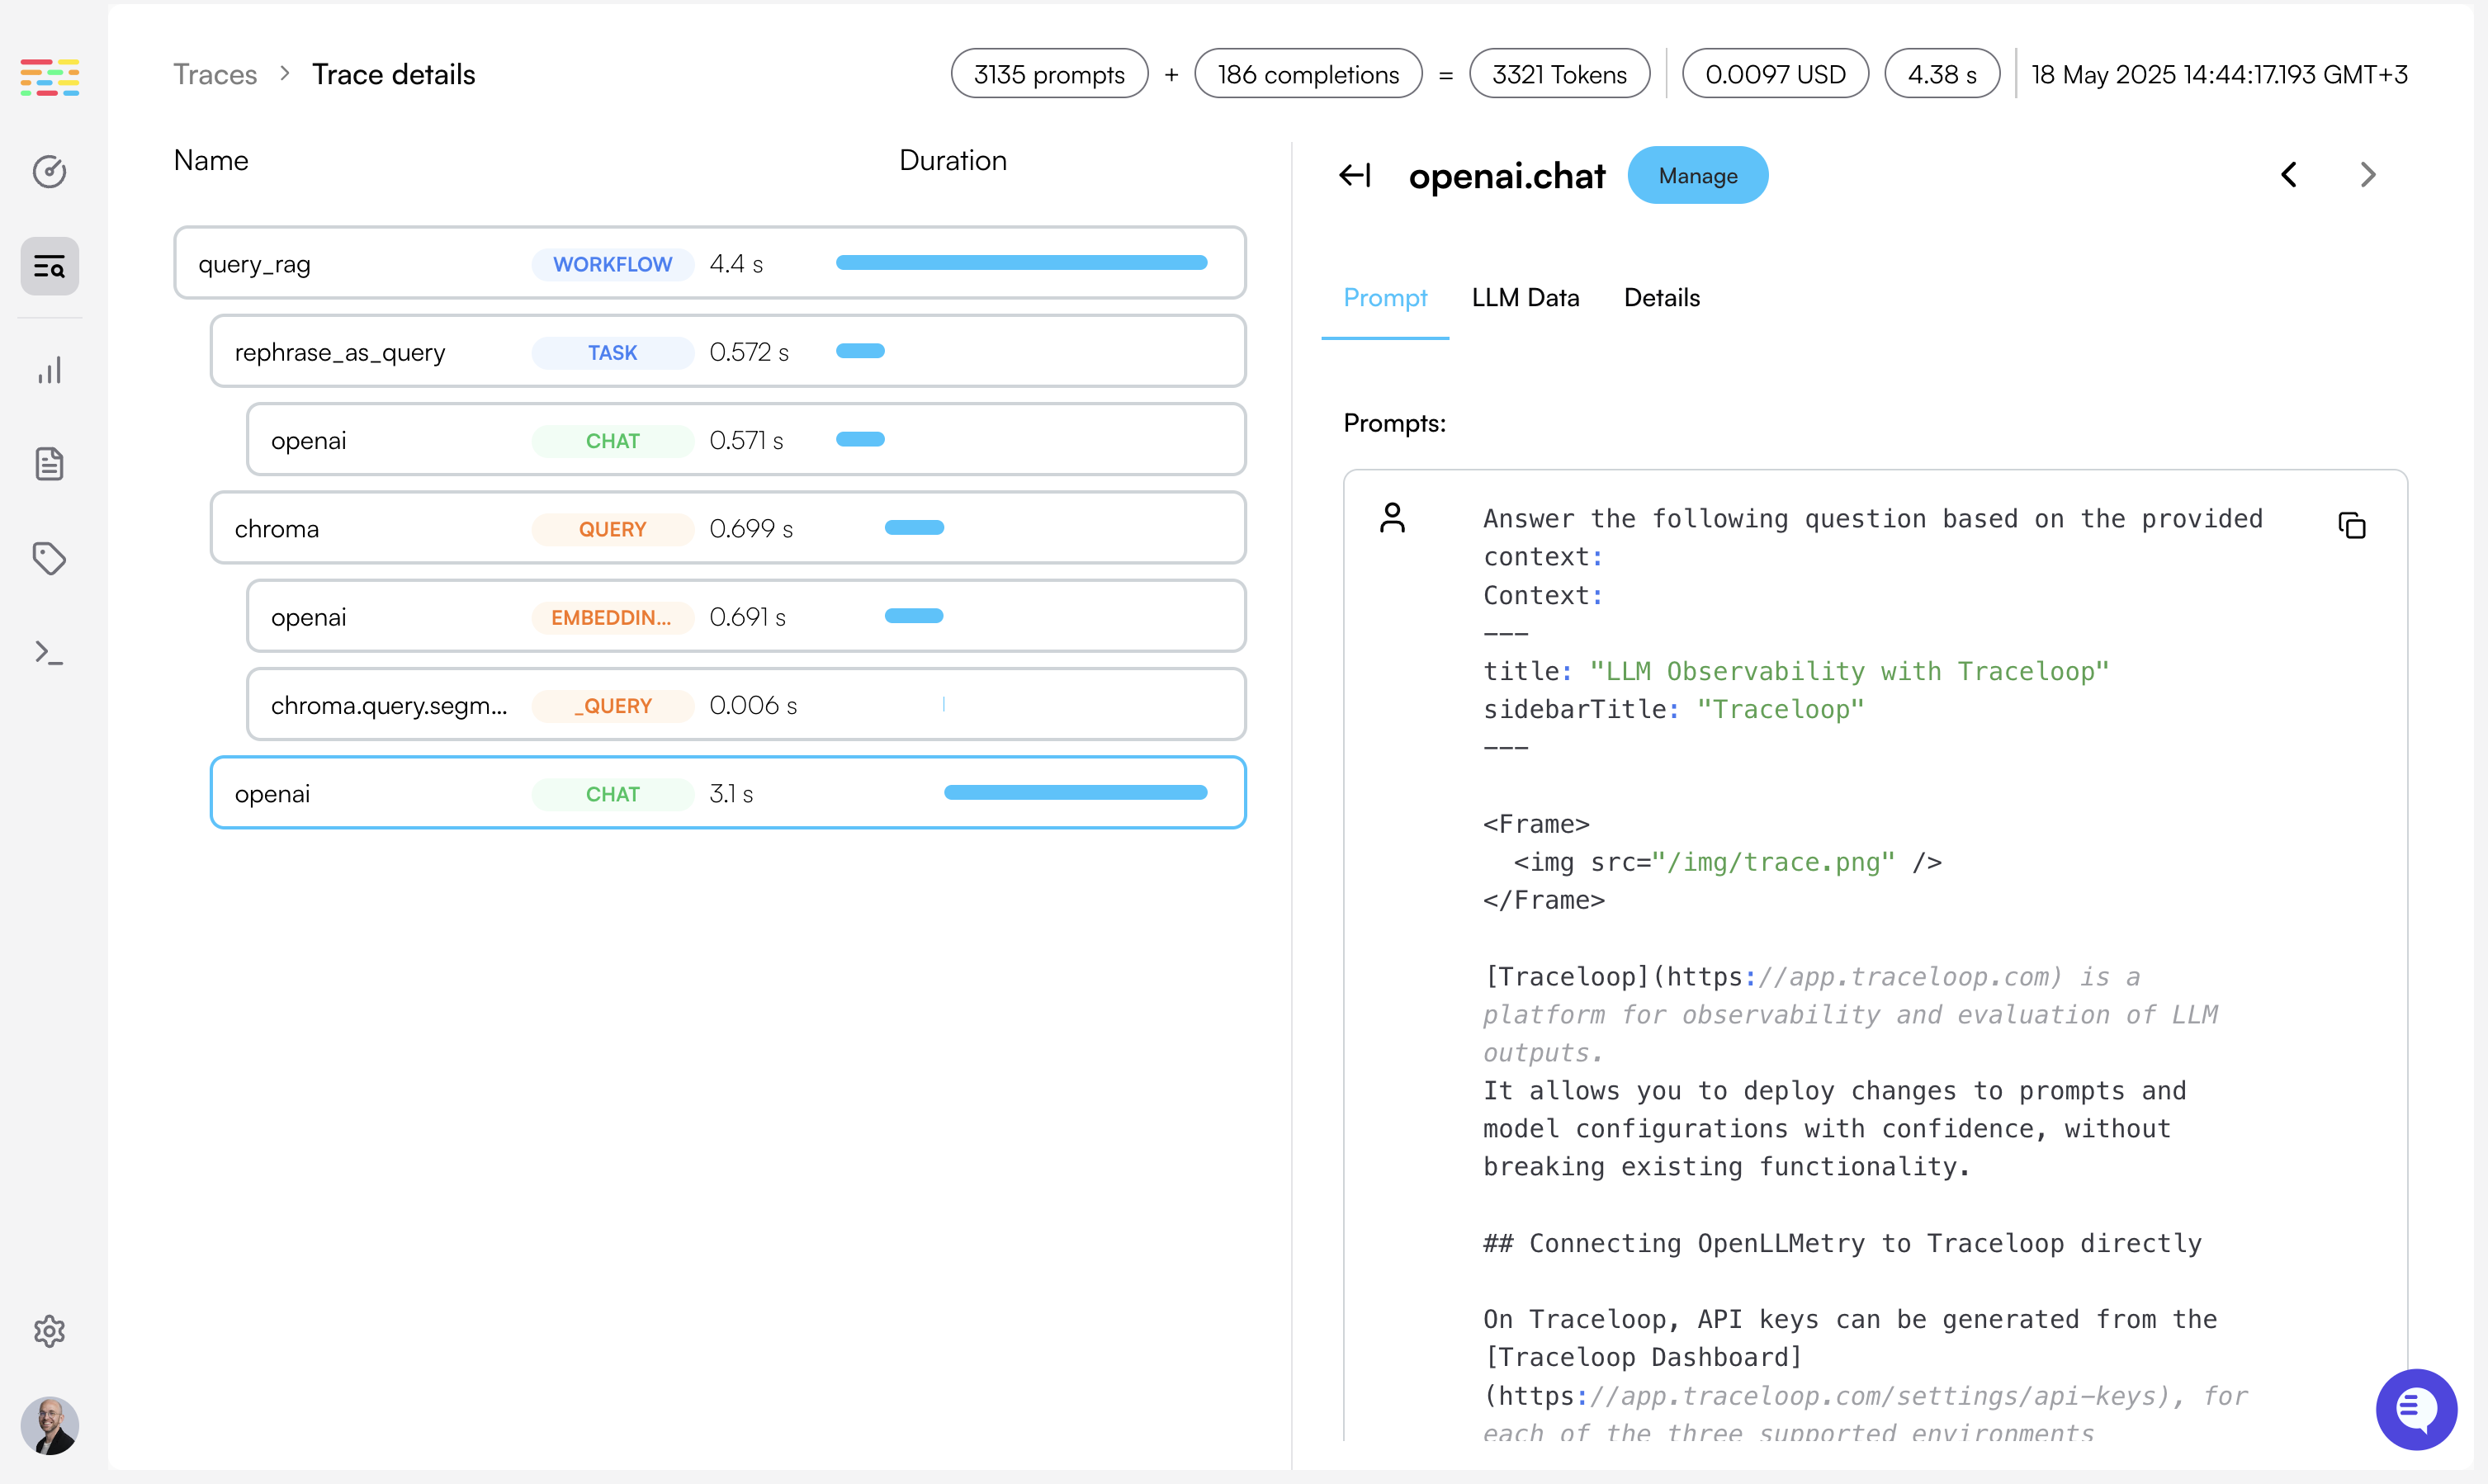
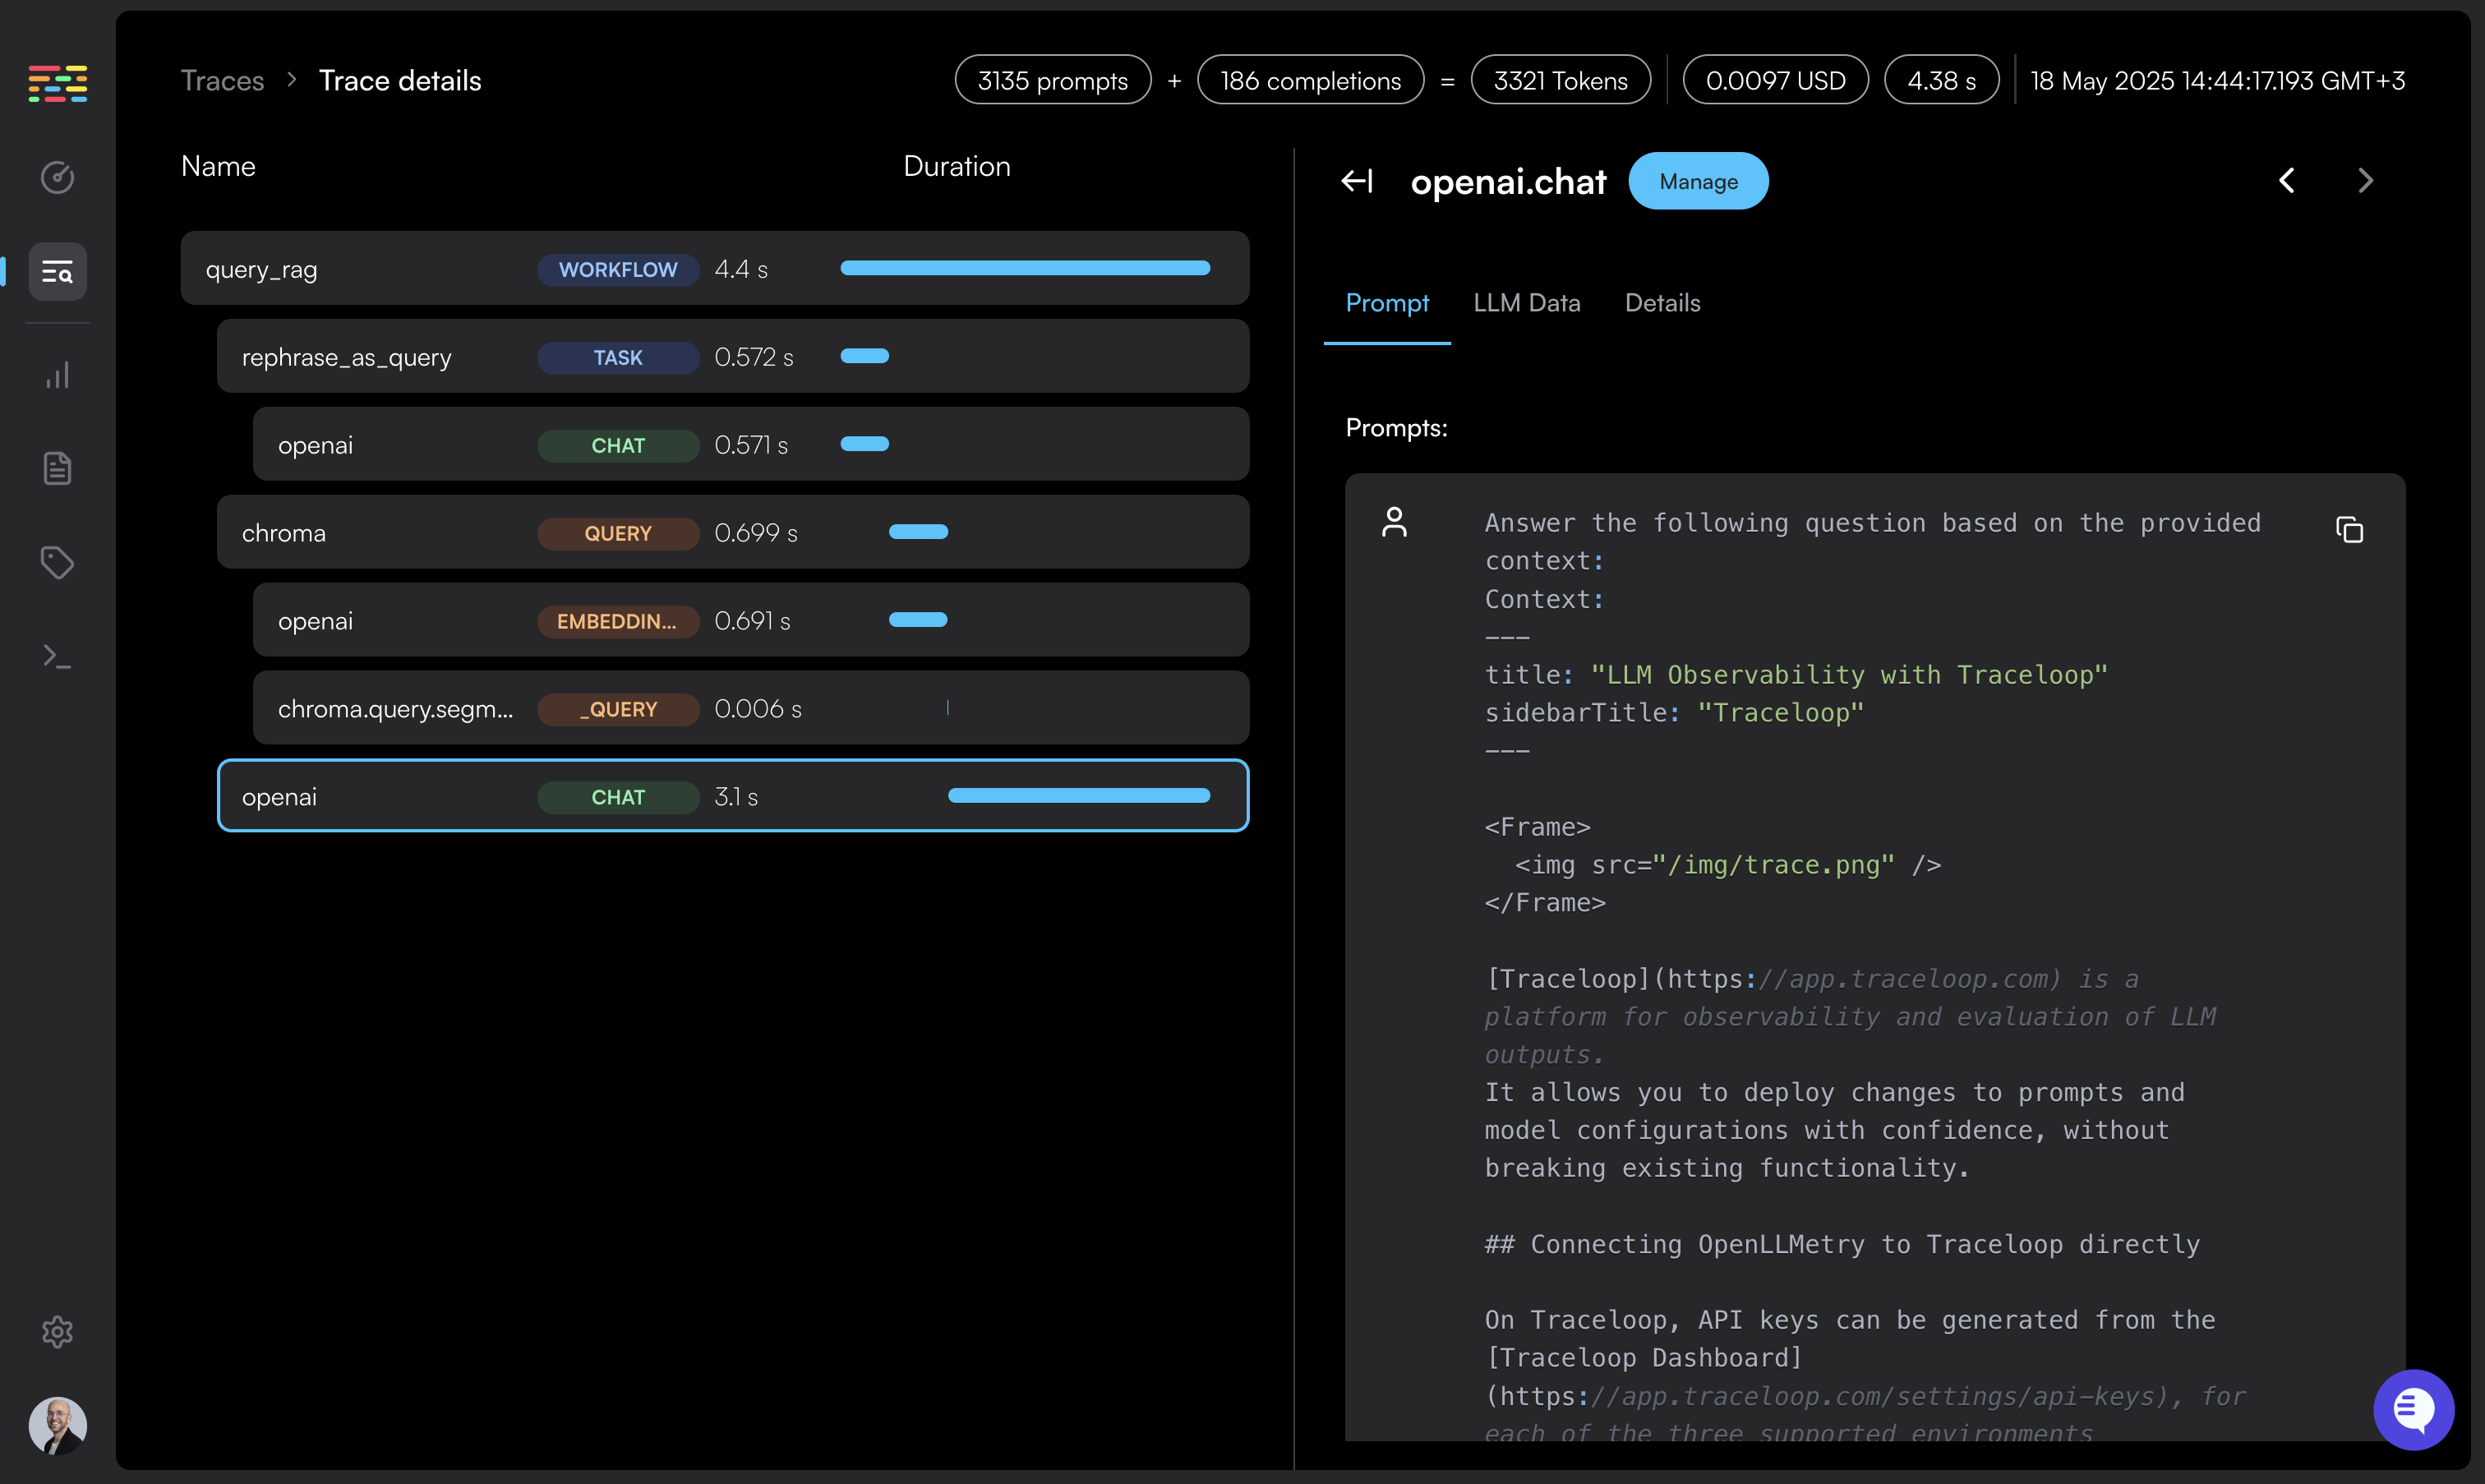 [Traceloop](https://app.traceloop.com) is a platform for observability and evaluation of LLM outputs.
It allows you to deploy changes to prompts and model configurations with confidence, without breaking existing functionality.
## Connecting OpenLLMetry to Traceloop directly
You need an API key to send traces to Traceloop. API keys are scoped to a specific **project** and **environment**.
**To generate an API key:**
1. Go to [Settings → Organization](https://app.traceloop.com/settings/api-keys)
2. Click on your project (or create a new one)
3. Select an environment (Development, Staging, Production, or custom)
4. Click **Generate API key**
5. **Copy the key immediately** - it won't be shown again after you close or reload the page
[Detailed instructions →](/settings/managing-api-keys)
Set the API key as an environment variable named `TRACELOOP_API_KEY`:
```bash theme={null}
export TRACELOOP_API_KEY=your_api_key_here
```
Done! You'll get instant visibility into everything that's happening with your LLM.
If you're calling a vector DB, or any other external service or database, you'll also see it in the Traceloop dashboard.
**Want to organize your data?** Learn about [Projects and Environments](/settings/projects-and-environments)
to separate traces for different applications and deployment stages.
## Using an OpenTelemetry Collector
If you are using an [OpenTelemetry Collector](https://opentelemetry.io/docs/collector/), you can route metrics and traces to Traceloop by simply adding an OTLP exporter to your collector configuration.
```yaml theme={null}
receivers:
otlp:
protocols:
http:
endpoint: 0.0.0.0:4318
processors:
batch:
exporters:
otlphttp/traceloop:
endpoint: "https://api.traceloop.com" # US instance
headers:
"Authorization": "Bearer "
service:
pipelines:
traces:
receivers: [otlp]
processors: [batch]
exporters: [otlphttp/traceloop]
```
You can route OpenLLMetry to your collector by following the [OpenTelemetry Collector](/openllmetry/integrations/otel-collector) integration instructions.
[Traceloop](https://app.traceloop.com) is a platform for observability and evaluation of LLM outputs.
It allows you to deploy changes to prompts and model configurations with confidence, without breaking existing functionality.
## Connecting OpenLLMetry to Traceloop directly
You need an API key to send traces to Traceloop. API keys are scoped to a specific **project** and **environment**.
**To generate an API key:**
1. Go to [Settings → Organization](https://app.traceloop.com/settings/api-keys)
2. Click on your project (or create a new one)
3. Select an environment (Development, Staging, Production, or custom)
4. Click **Generate API key**
5. **Copy the key immediately** - it won't be shown again after you close or reload the page
[Detailed instructions →](/settings/managing-api-keys)
Set the API key as an environment variable named `TRACELOOP_API_KEY`:
```bash theme={null}
export TRACELOOP_API_KEY=your_api_key_here
```
Done! You'll get instant visibility into everything that's happening with your LLM.
If you're calling a vector DB, or any other external service or database, you'll also see it in the Traceloop dashboard.
**Want to organize your data?** Learn about [Projects and Environments](/settings/projects-and-environments)
to separate traces for different applications and deployment stages.
## Using an OpenTelemetry Collector
If you are using an [OpenTelemetry Collector](https://opentelemetry.io/docs/collector/), you can route metrics and traces to Traceloop by simply adding an OTLP exporter to your collector configuration.
```yaml theme={null}
receivers:
otlp:
protocols:
http:
endpoint: 0.0.0.0:4318
processors:
batch:
exporters:
otlphttp/traceloop:
endpoint: "https://api.traceloop.com" # US instance
headers:
"Authorization": "Bearer "
service:
pipelines:
traces:
receivers: [otlp]
processors: [batch]
exporters: [otlphttp/traceloop]
```
You can route OpenLLMetry to your collector by following the [OpenTelemetry Collector](/openllmetry/integrations/otel-collector) integration instructions.