> ## Documentation Index
> Fetch the complete documentation index at: https://enrolla-nk-hub-guardrails.mintlify.site/llms.txt
> Use this file to discover all available pages before exploring further.
# LLM Observability with Middleware and OpenLLMetry
 To send OpenTelemetry metrics and traces generated by Traceloop from your LLM Application to Middleware, Follow the below steps.
1. Sign in to your [Middleware](https://app.middleware.io/) account.
2. Go to settings and click on API Key. [Link](https://app.middleware.io/settings/api-keys)
3. Copy and Save the value for `MW_API_KEY` and `MW_TARGET`
```python theme={null}
from traceloop.sdk import Traceloop
Traceloop.init(
app_name="YOUR_APPLICATION_NAME",
api_endpoint="",
headers={
"Authorization": "",
"X-Trace-Source": "traceloop",
},
resource_attributes={"key": "value"},
)
```
```javascript theme={null}
import * as traceloop from "@traceloop/node-server-sdk";
traceloop.initialize({
appName: "YOUR_APPLICATION_NAME",
apiEndpoint: "",
headers: {
Authorization: "",
"X-Trace-Source": "traceloop",
},
resourceAttributes: { "key": "value" },
});
```
Replace:
1. `MW_TARGET` with your middleware target url
* Example - `https://abcde.middleware.io`
2. `MW_API_KEY` with your middleware api key.
* Example - nxhqwpbvcmlkjhgfdsazxcvbnmkjhgtyui
Refer to the Traceloop [Docs](https://www.traceloop.com/docs/introduction) for more advanced configurations and use cases.
For detailed information on LLM Observability with Middleware and Traceloop, consult Middleware Documentation:
[LLM Observability Documentation](https://docs.middleware.io/llm-observability/overview).
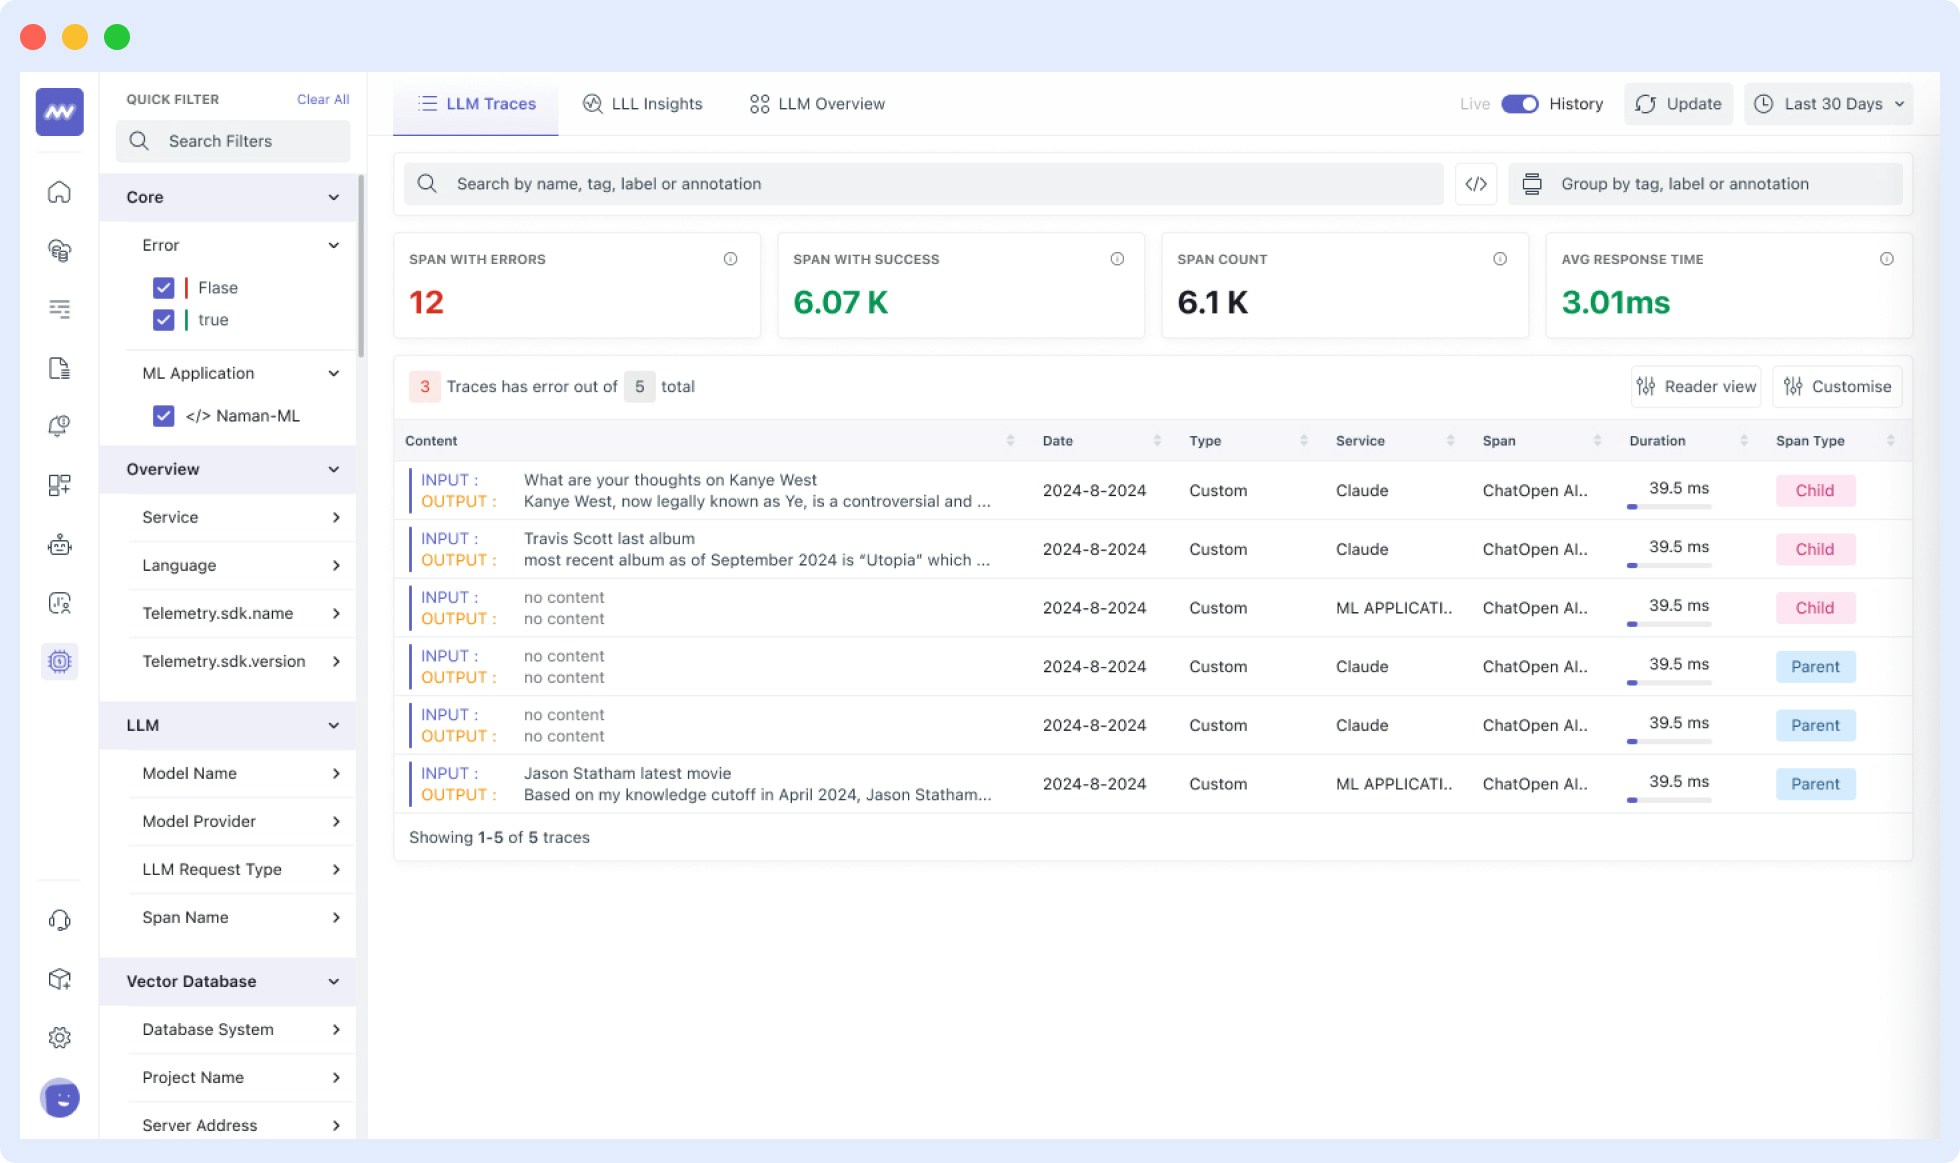
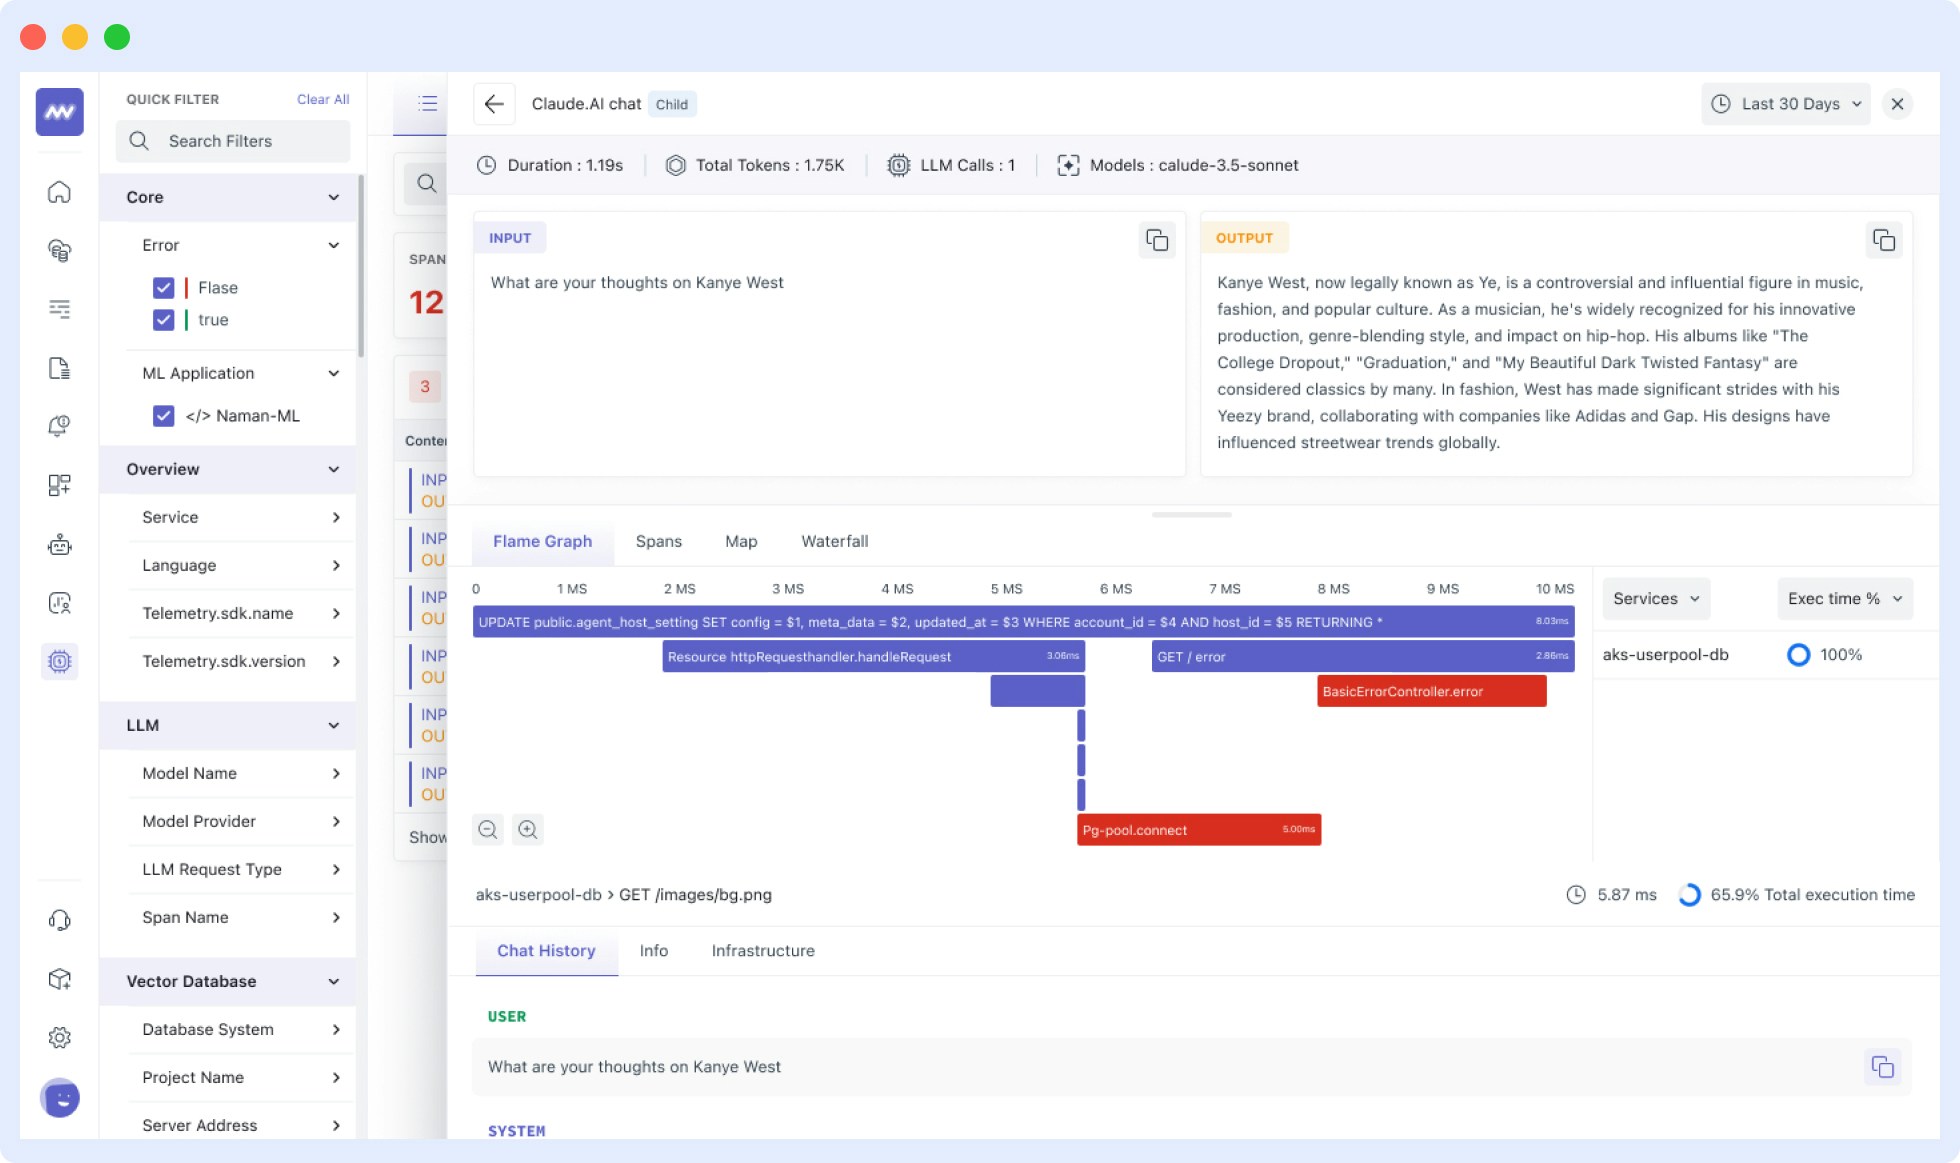
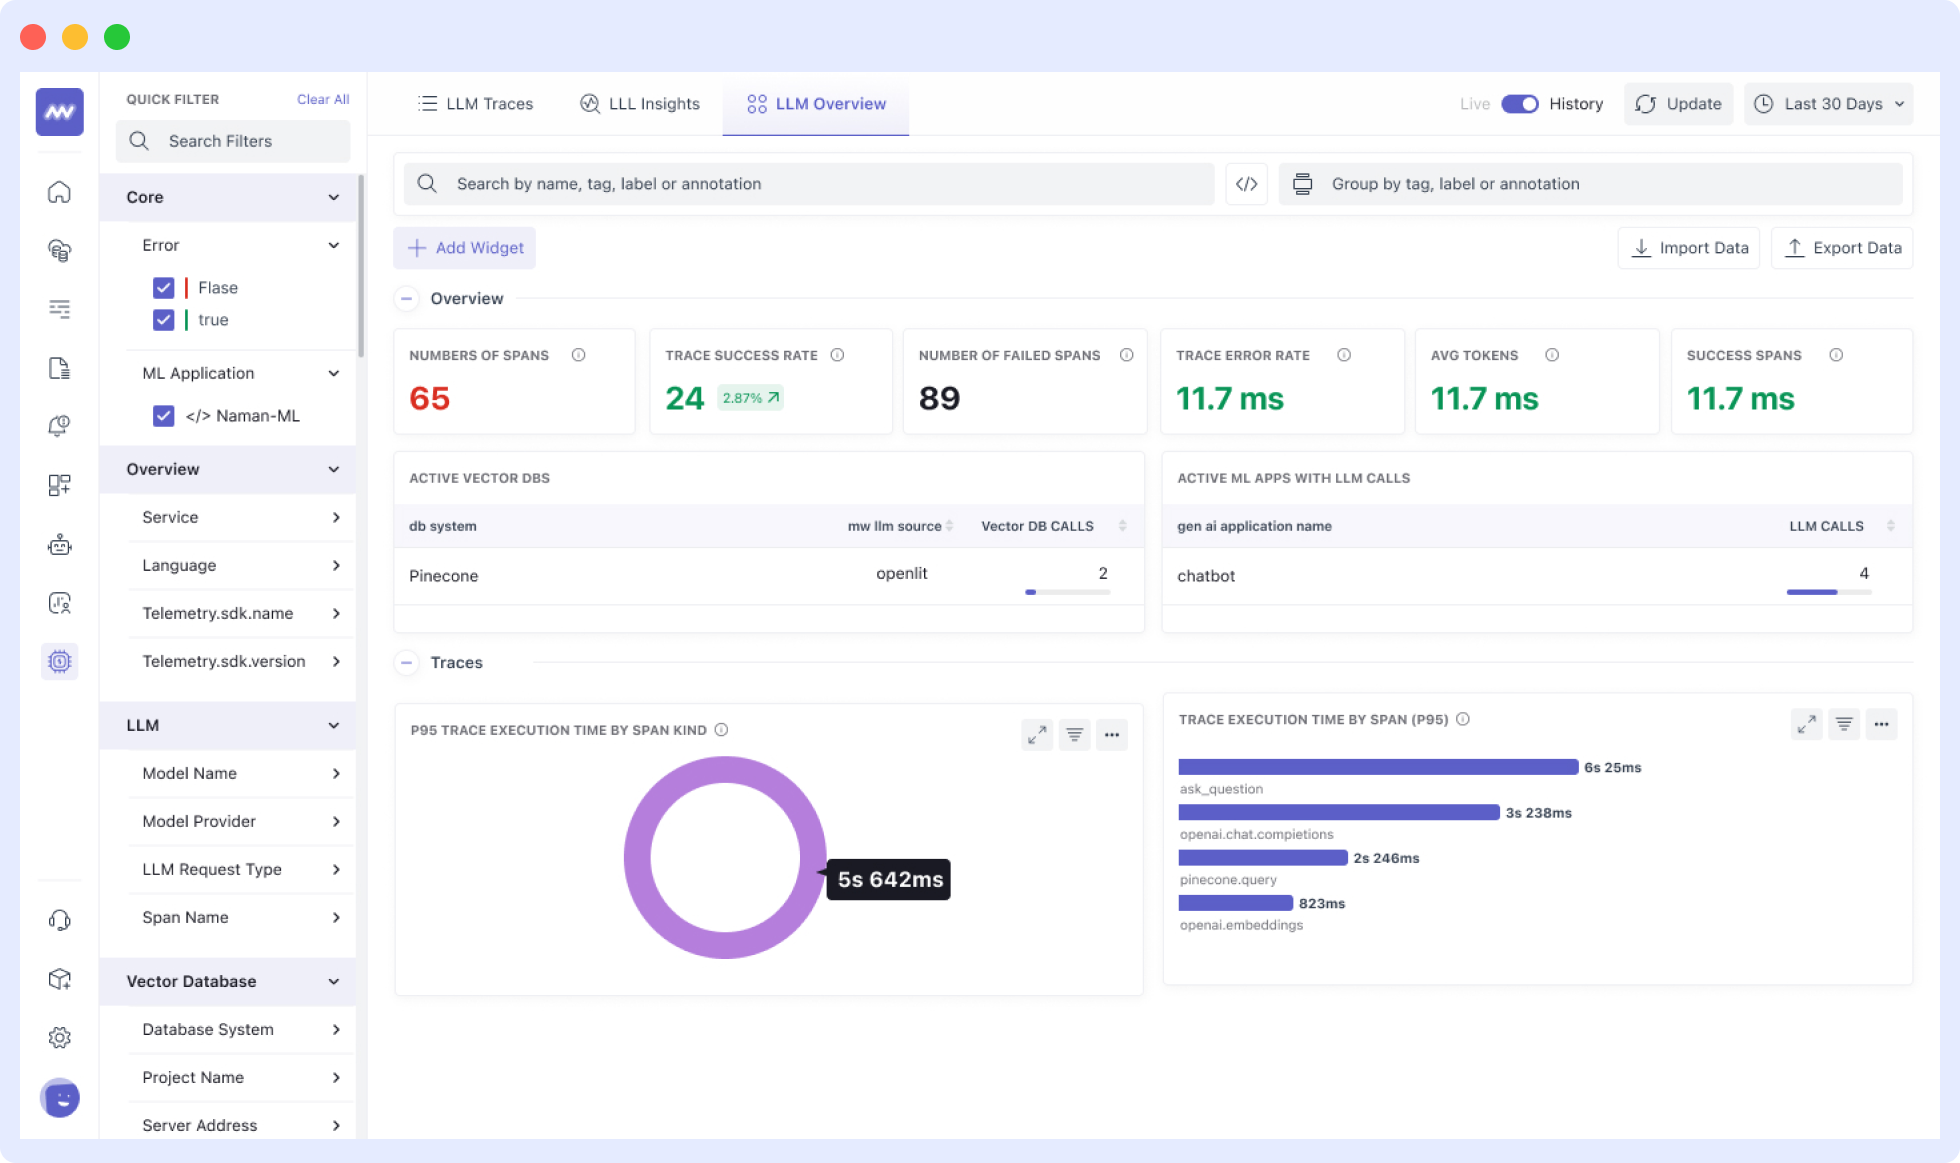
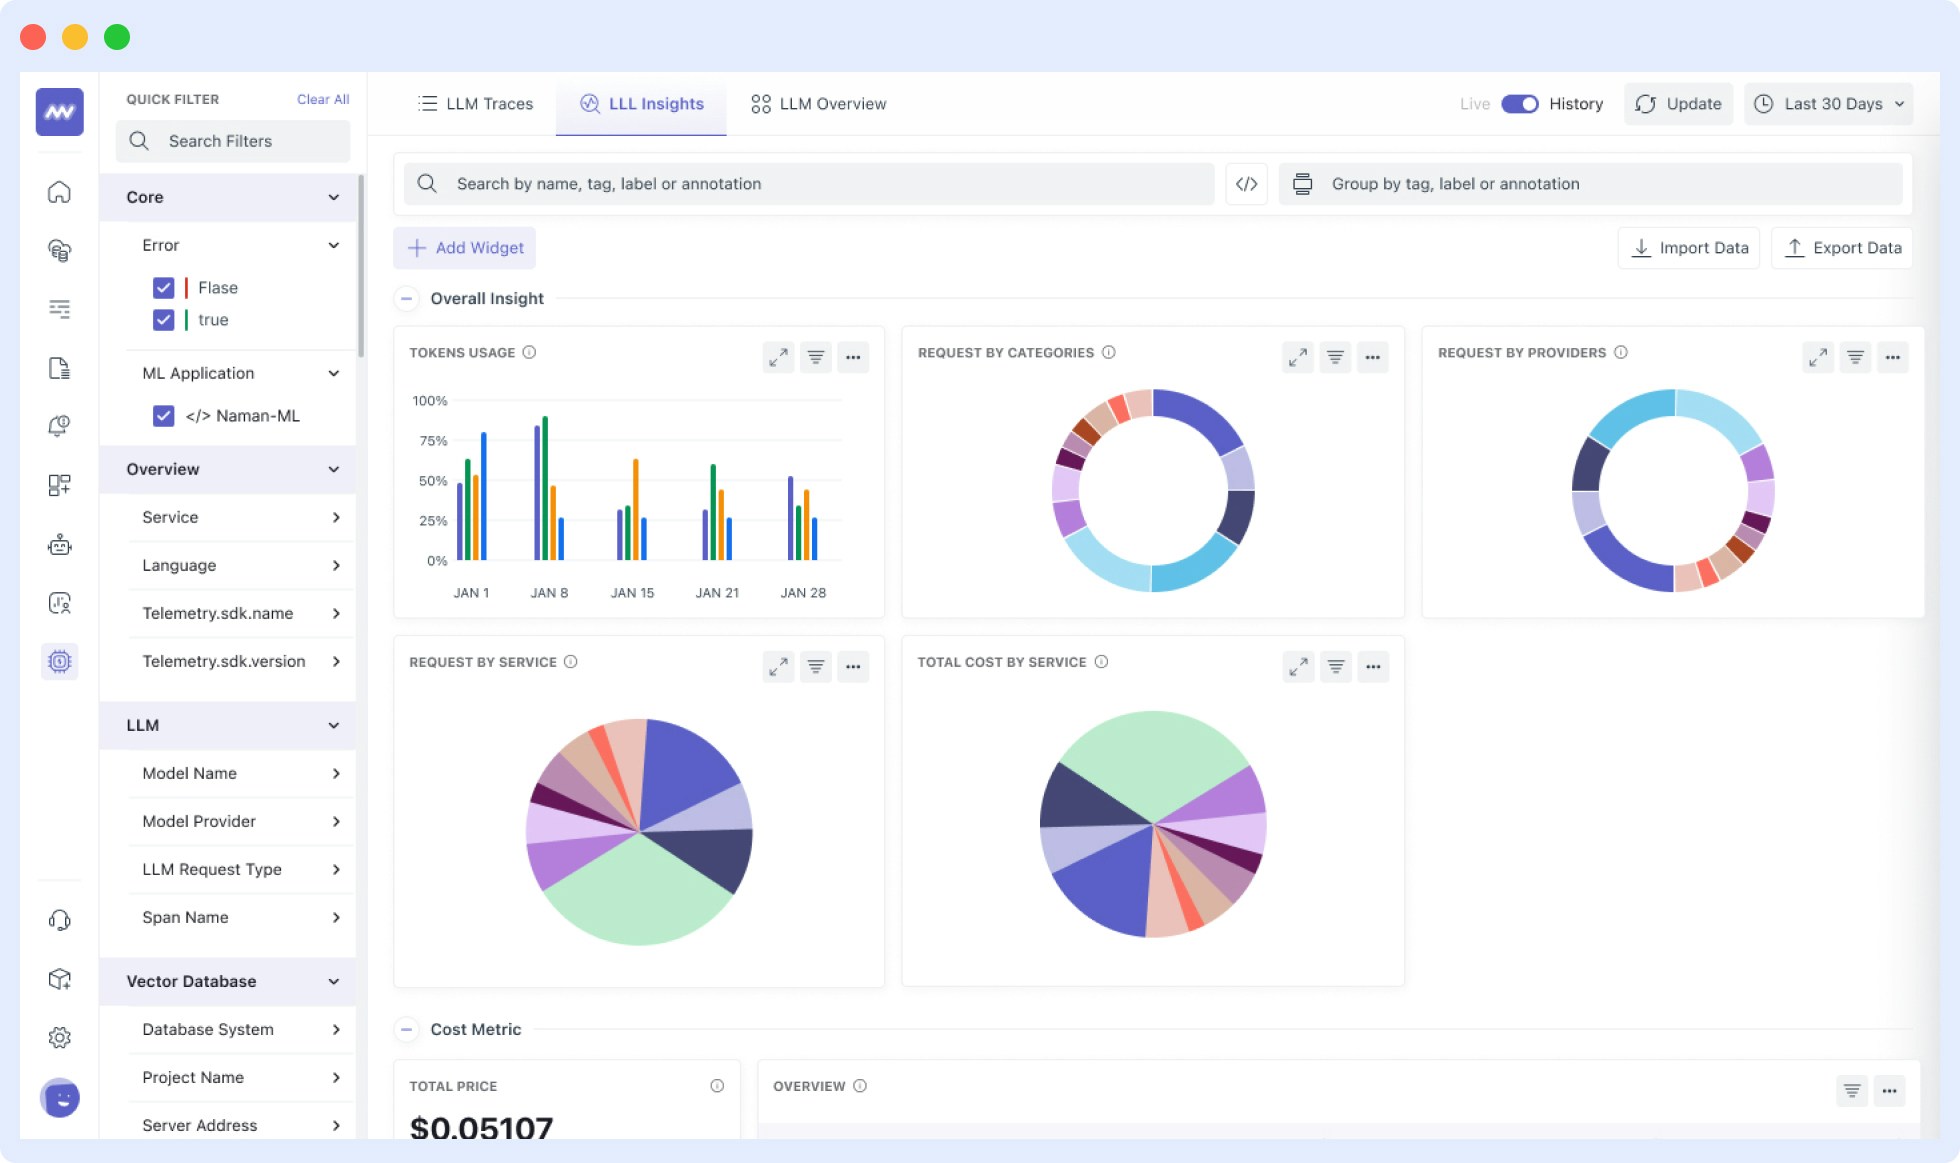
Once your LLM application is instrumented, you can view the traces, metrics and dashboards in the Middleware LLM Observability section. To access this:
1. Log in to your Middleware account
2. Navigate to the [LLM Observability Section](https://app.middleware.io/llm) in the sidebar
***
To send OpenTelemetry metrics and traces generated by Traceloop from your LLM Application to Middleware, Follow the below steps.
1. Sign in to your [Middleware](https://app.middleware.io/) account.
2. Go to settings and click on API Key. [Link](https://app.middleware.io/settings/api-keys)
3. Copy and Save the value for `MW_API_KEY` and `MW_TARGET`
```python theme={null}
from traceloop.sdk import Traceloop
Traceloop.init(
app_name="YOUR_APPLICATION_NAME",
api_endpoint="",
headers={
"Authorization": "",
"X-Trace-Source": "traceloop",
},
resource_attributes={"key": "value"},
)
```
```javascript theme={null}
import * as traceloop from "@traceloop/node-server-sdk";
traceloop.initialize({
appName: "YOUR_APPLICATION_NAME",
apiEndpoint: "",
headers: {
Authorization: "",
"X-Trace-Source": "traceloop",
},
resourceAttributes: { "key": "value" },
});
```
Replace:
1. `MW_TARGET` with your middleware target url
* Example - `https://abcde.middleware.io`
2. `MW_API_KEY` with your middleware api key.
* Example - nxhqwpbvcmlkjhgfdsazxcvbnmkjhgtyui
Refer to the Traceloop [Docs](https://www.traceloop.com/docs/introduction) for more advanced configurations and use cases.
For detailed information on LLM Observability with Middleware and Traceloop, consult Middleware Documentation:
[LLM Observability Documentation](https://docs.middleware.io/llm-observability/overview).
Once your LLM application is instrumented, you can view the traces, metrics and dashboards in the Middleware LLM Observability section. To access this:
1. Log in to your Middleware account
2. Navigate to the [LLM Observability Section](https://app.middleware.io/llm) in the sidebar
***