> ## Documentation Index
> Fetch the complete documentation index at: https://enrolla-nk-hub-guardrails.mintlify.site/llms.txt
> Use this file to discover all available pages before exploring further.
# Using Monitors
> Learn how to view, analyze, and act on monitor results in your LLM applications
Once you've created monitors, Traceloop continuously evaluates your LLM outputs and provides insights into their performance. This guide explains how to interpret and act on monitor results.
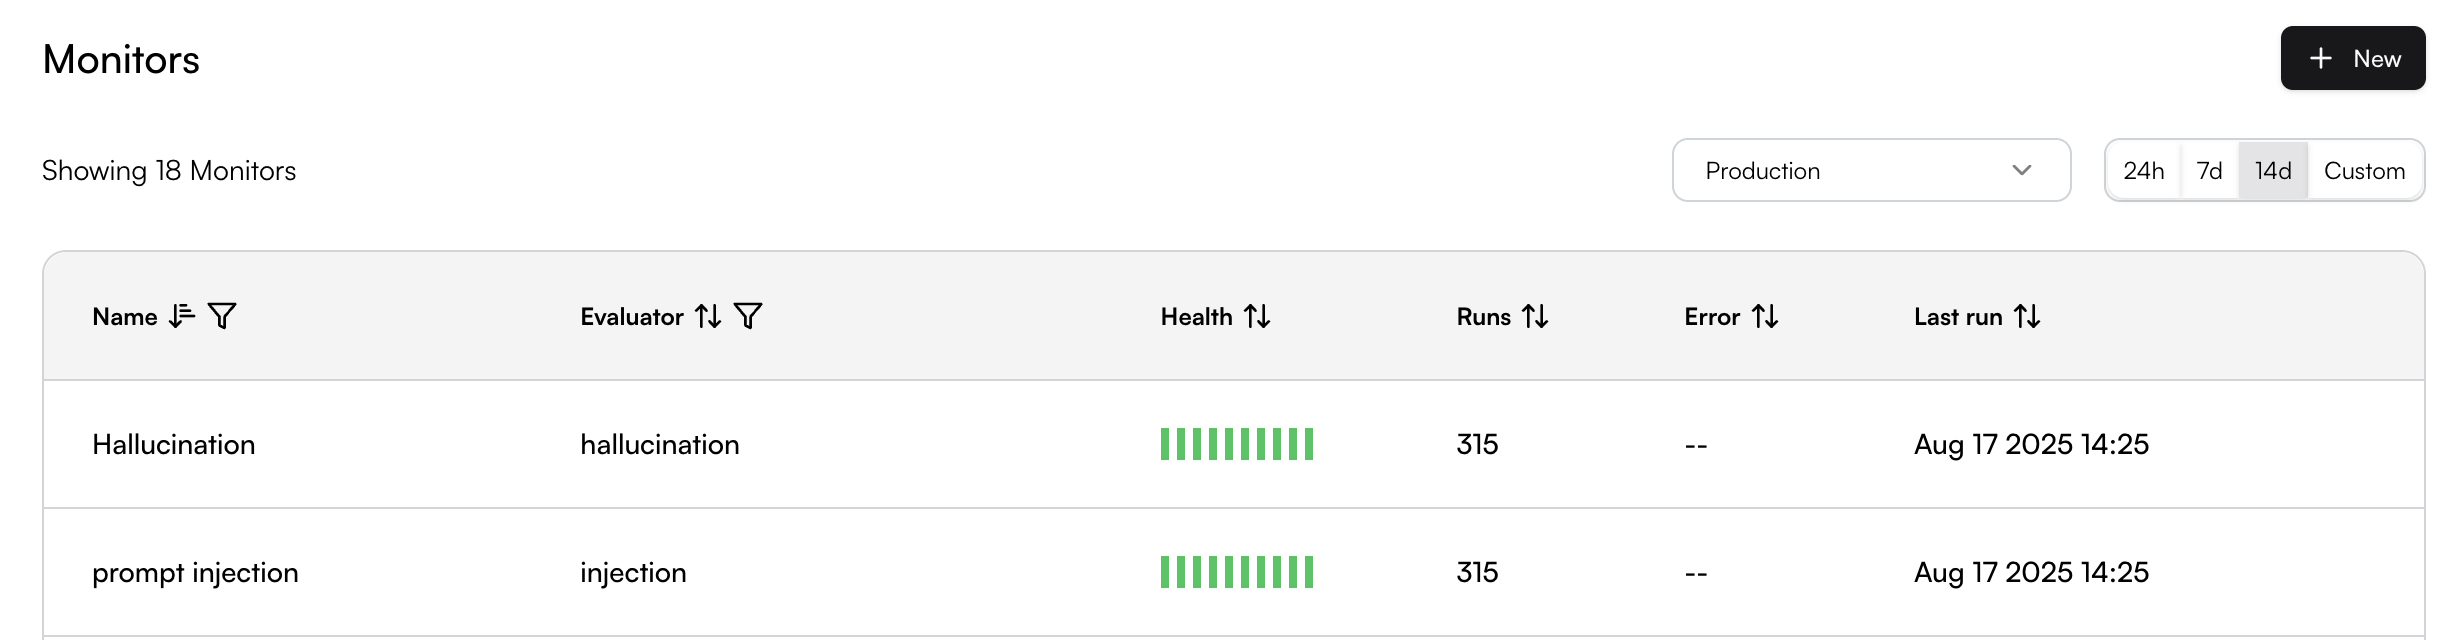
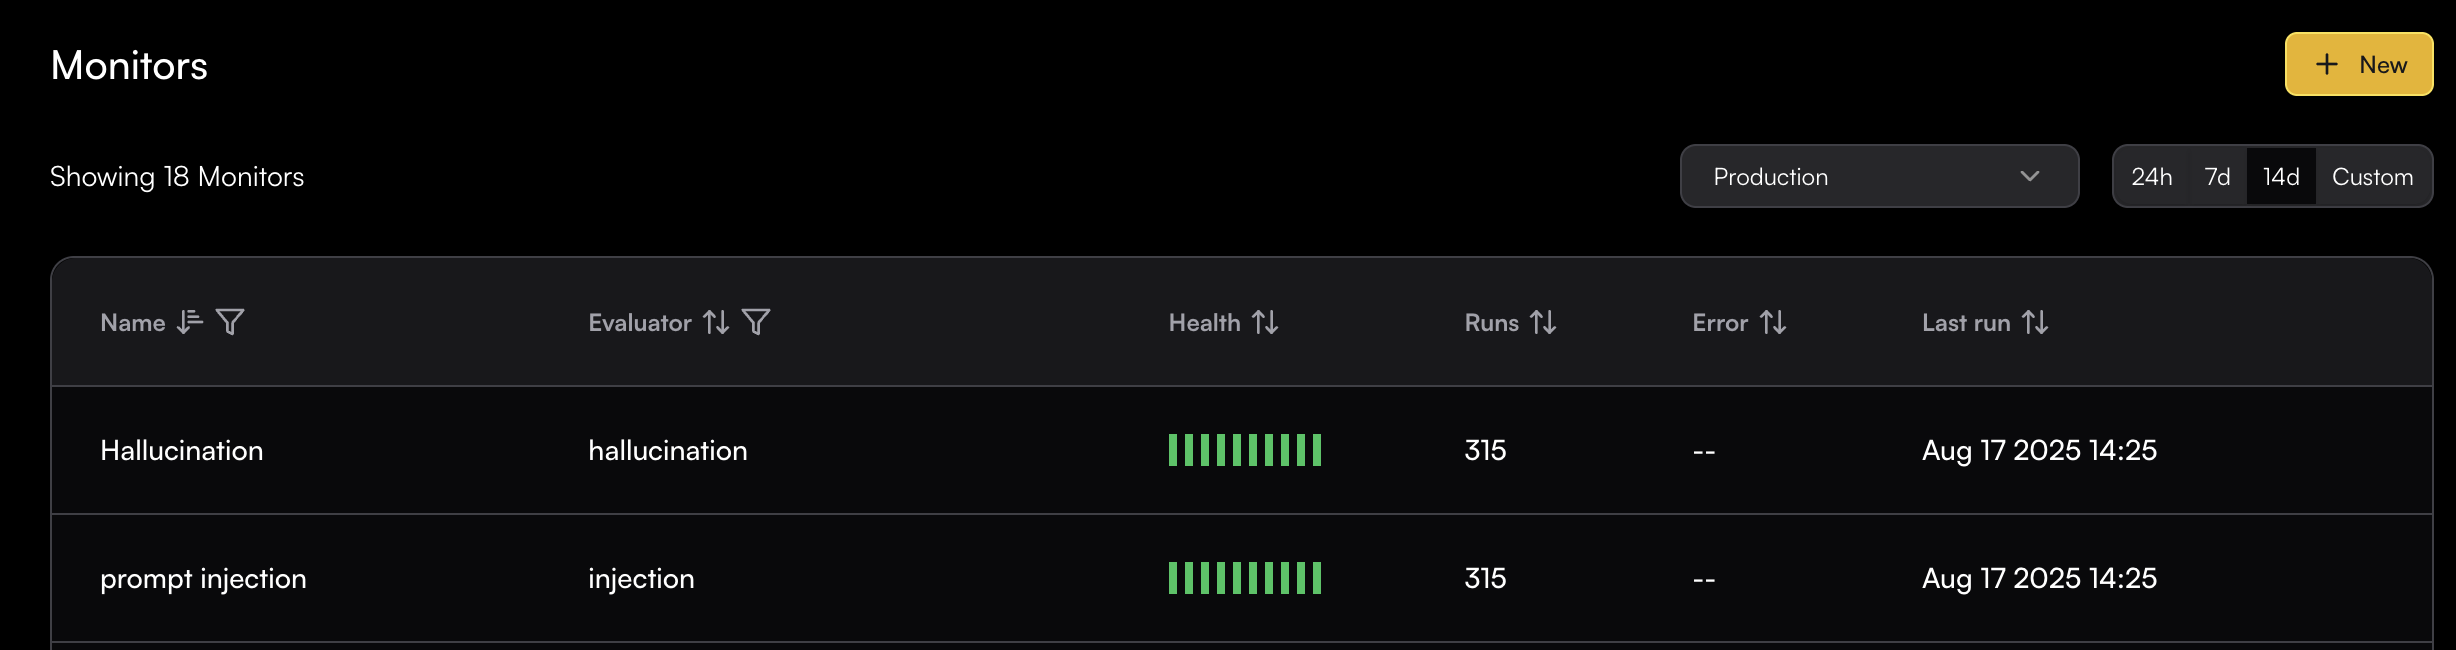
## Monitor Dashboard
The Monitor Dashboard provides an overview of all active monitors and their current status.
It shows each monitor’s health, the number of times it has run, and the most recent execution time.
 ## Viewing Monitor Results
### Real-time Monitoring
Monitor results are displayed in real-time as your LLM applications generate new spans. You can view:
* **Run Details**: The span value that was evaluated and its result
* **Trend Analysis**: Performance over time
* **Volume Metrics**: Number of evaluations performed
* **Evaluator Output Rates**: Such as success rates for threshold-based evaluators
### Monitor Results Page
Click on any monitor to access its detailed results page. The monitor page provides comprehensive analytics and span-level details.
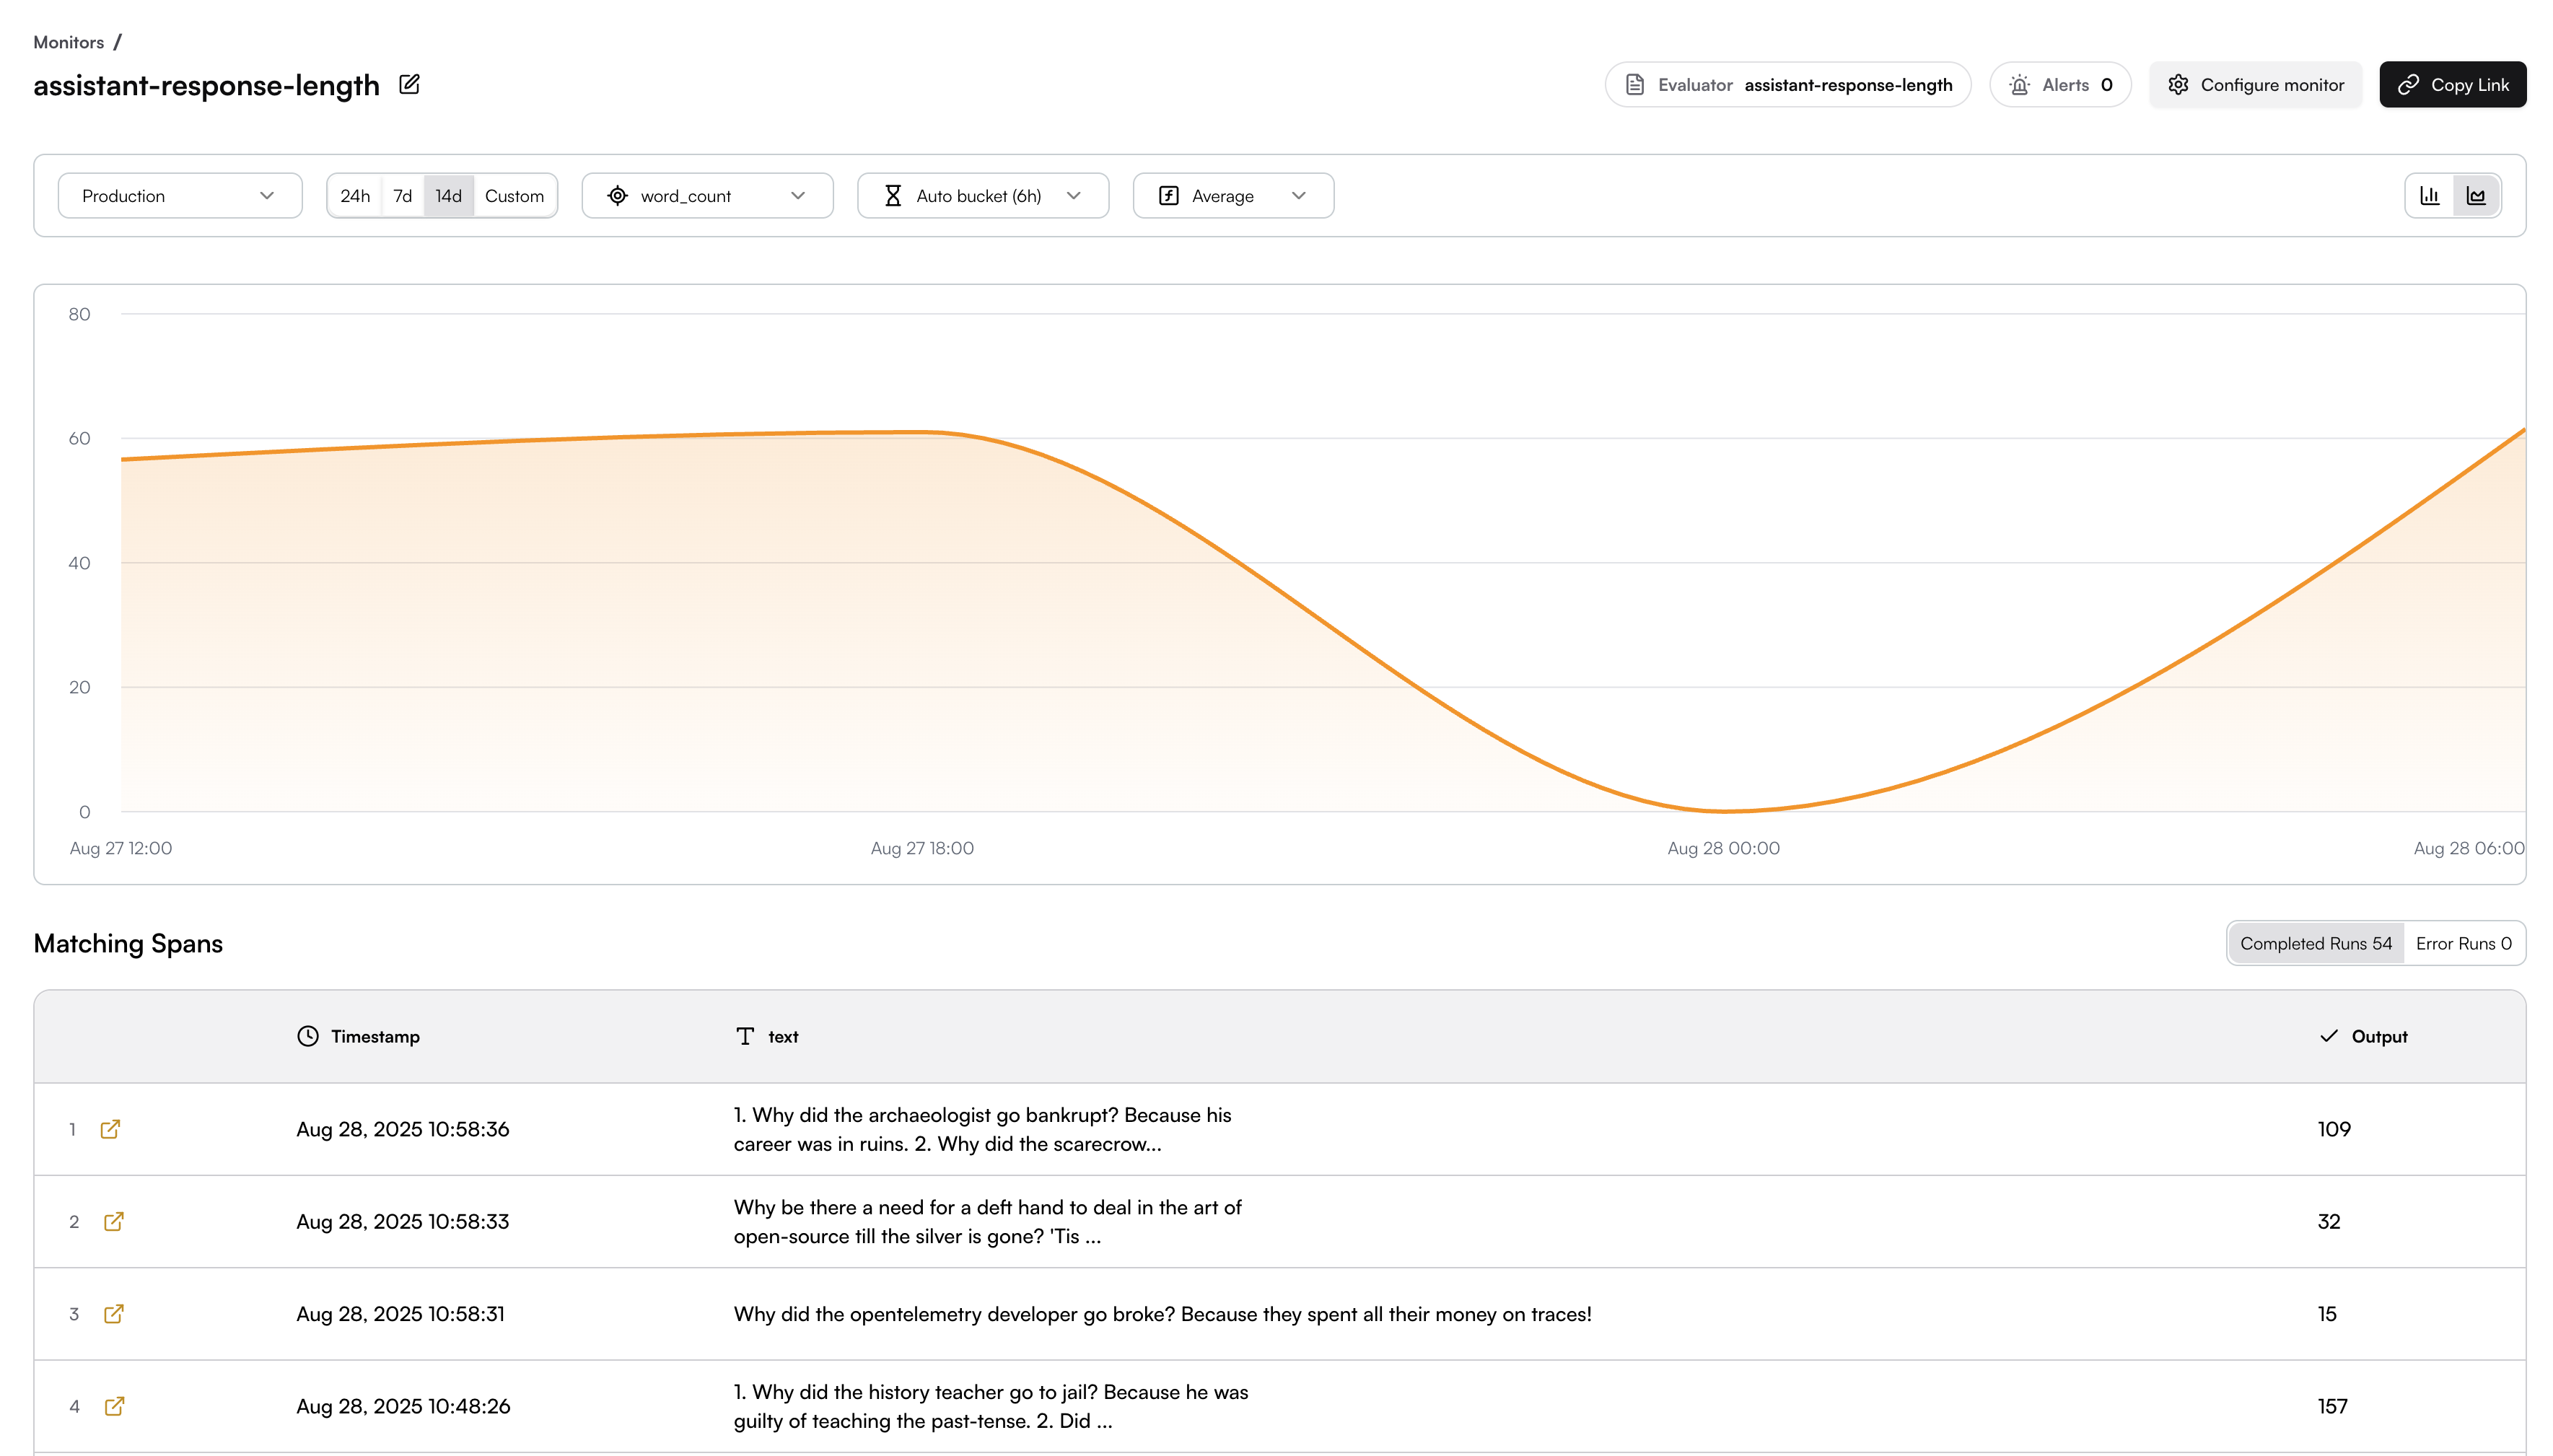
#### Chart Visualizations
The Monitor page includes multiple chart views to help you analyze your data, and you can switch between chart types using the selector in the top-right corner.
**Line Chart View** - Shows evaluation trends over time:
## Viewing Monitor Results
### Real-time Monitoring
Monitor results are displayed in real-time as your LLM applications generate new spans. You can view:
* **Run Details**: The span value that was evaluated and its result
* **Trend Analysis**: Performance over time
* **Volume Metrics**: Number of evaluations performed
* **Evaluator Output Rates**: Such as success rates for threshold-based evaluators
### Monitor Results Page
Click on any monitor to access its detailed results page. The monitor page provides comprehensive analytics and span-level details.
#### Chart Visualizations
The Monitor page includes multiple chart views to help you analyze your data, and you can switch between chart types using the selector in the top-right corner.
**Line Chart View** - Shows evaluation trends over time:
 **Bar Chart View** - Displays evaluation results in time buckets:
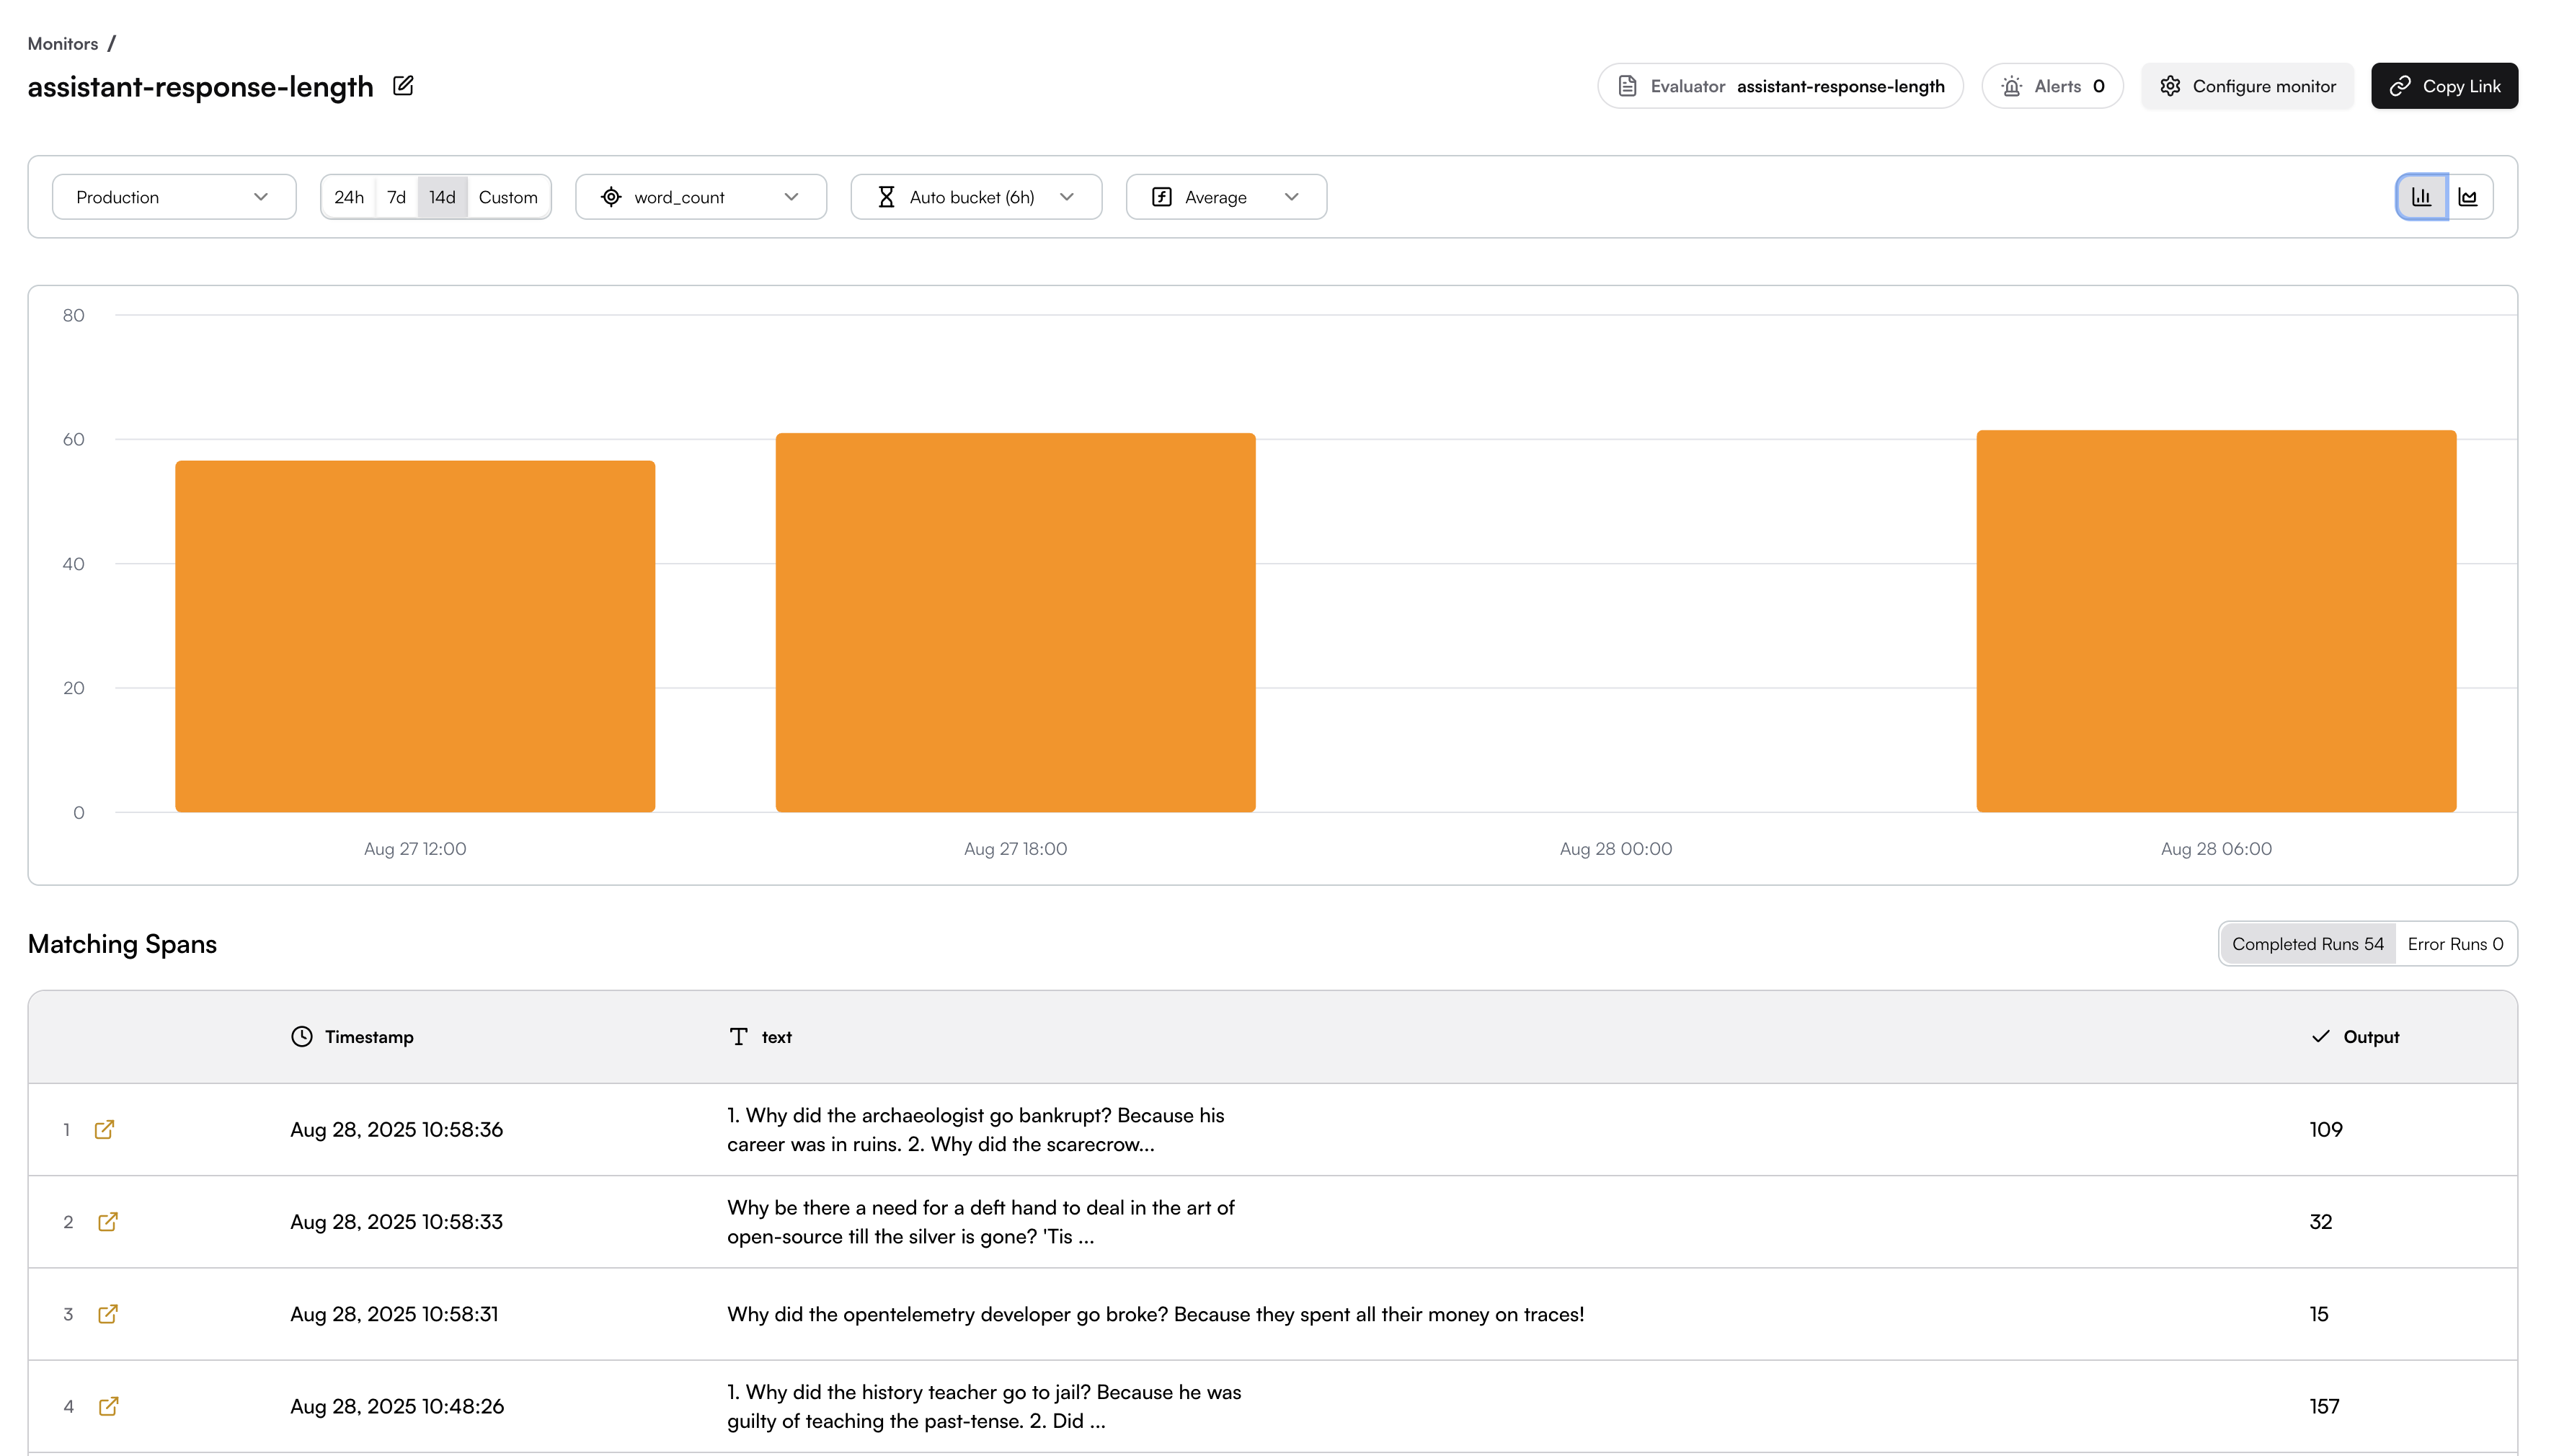
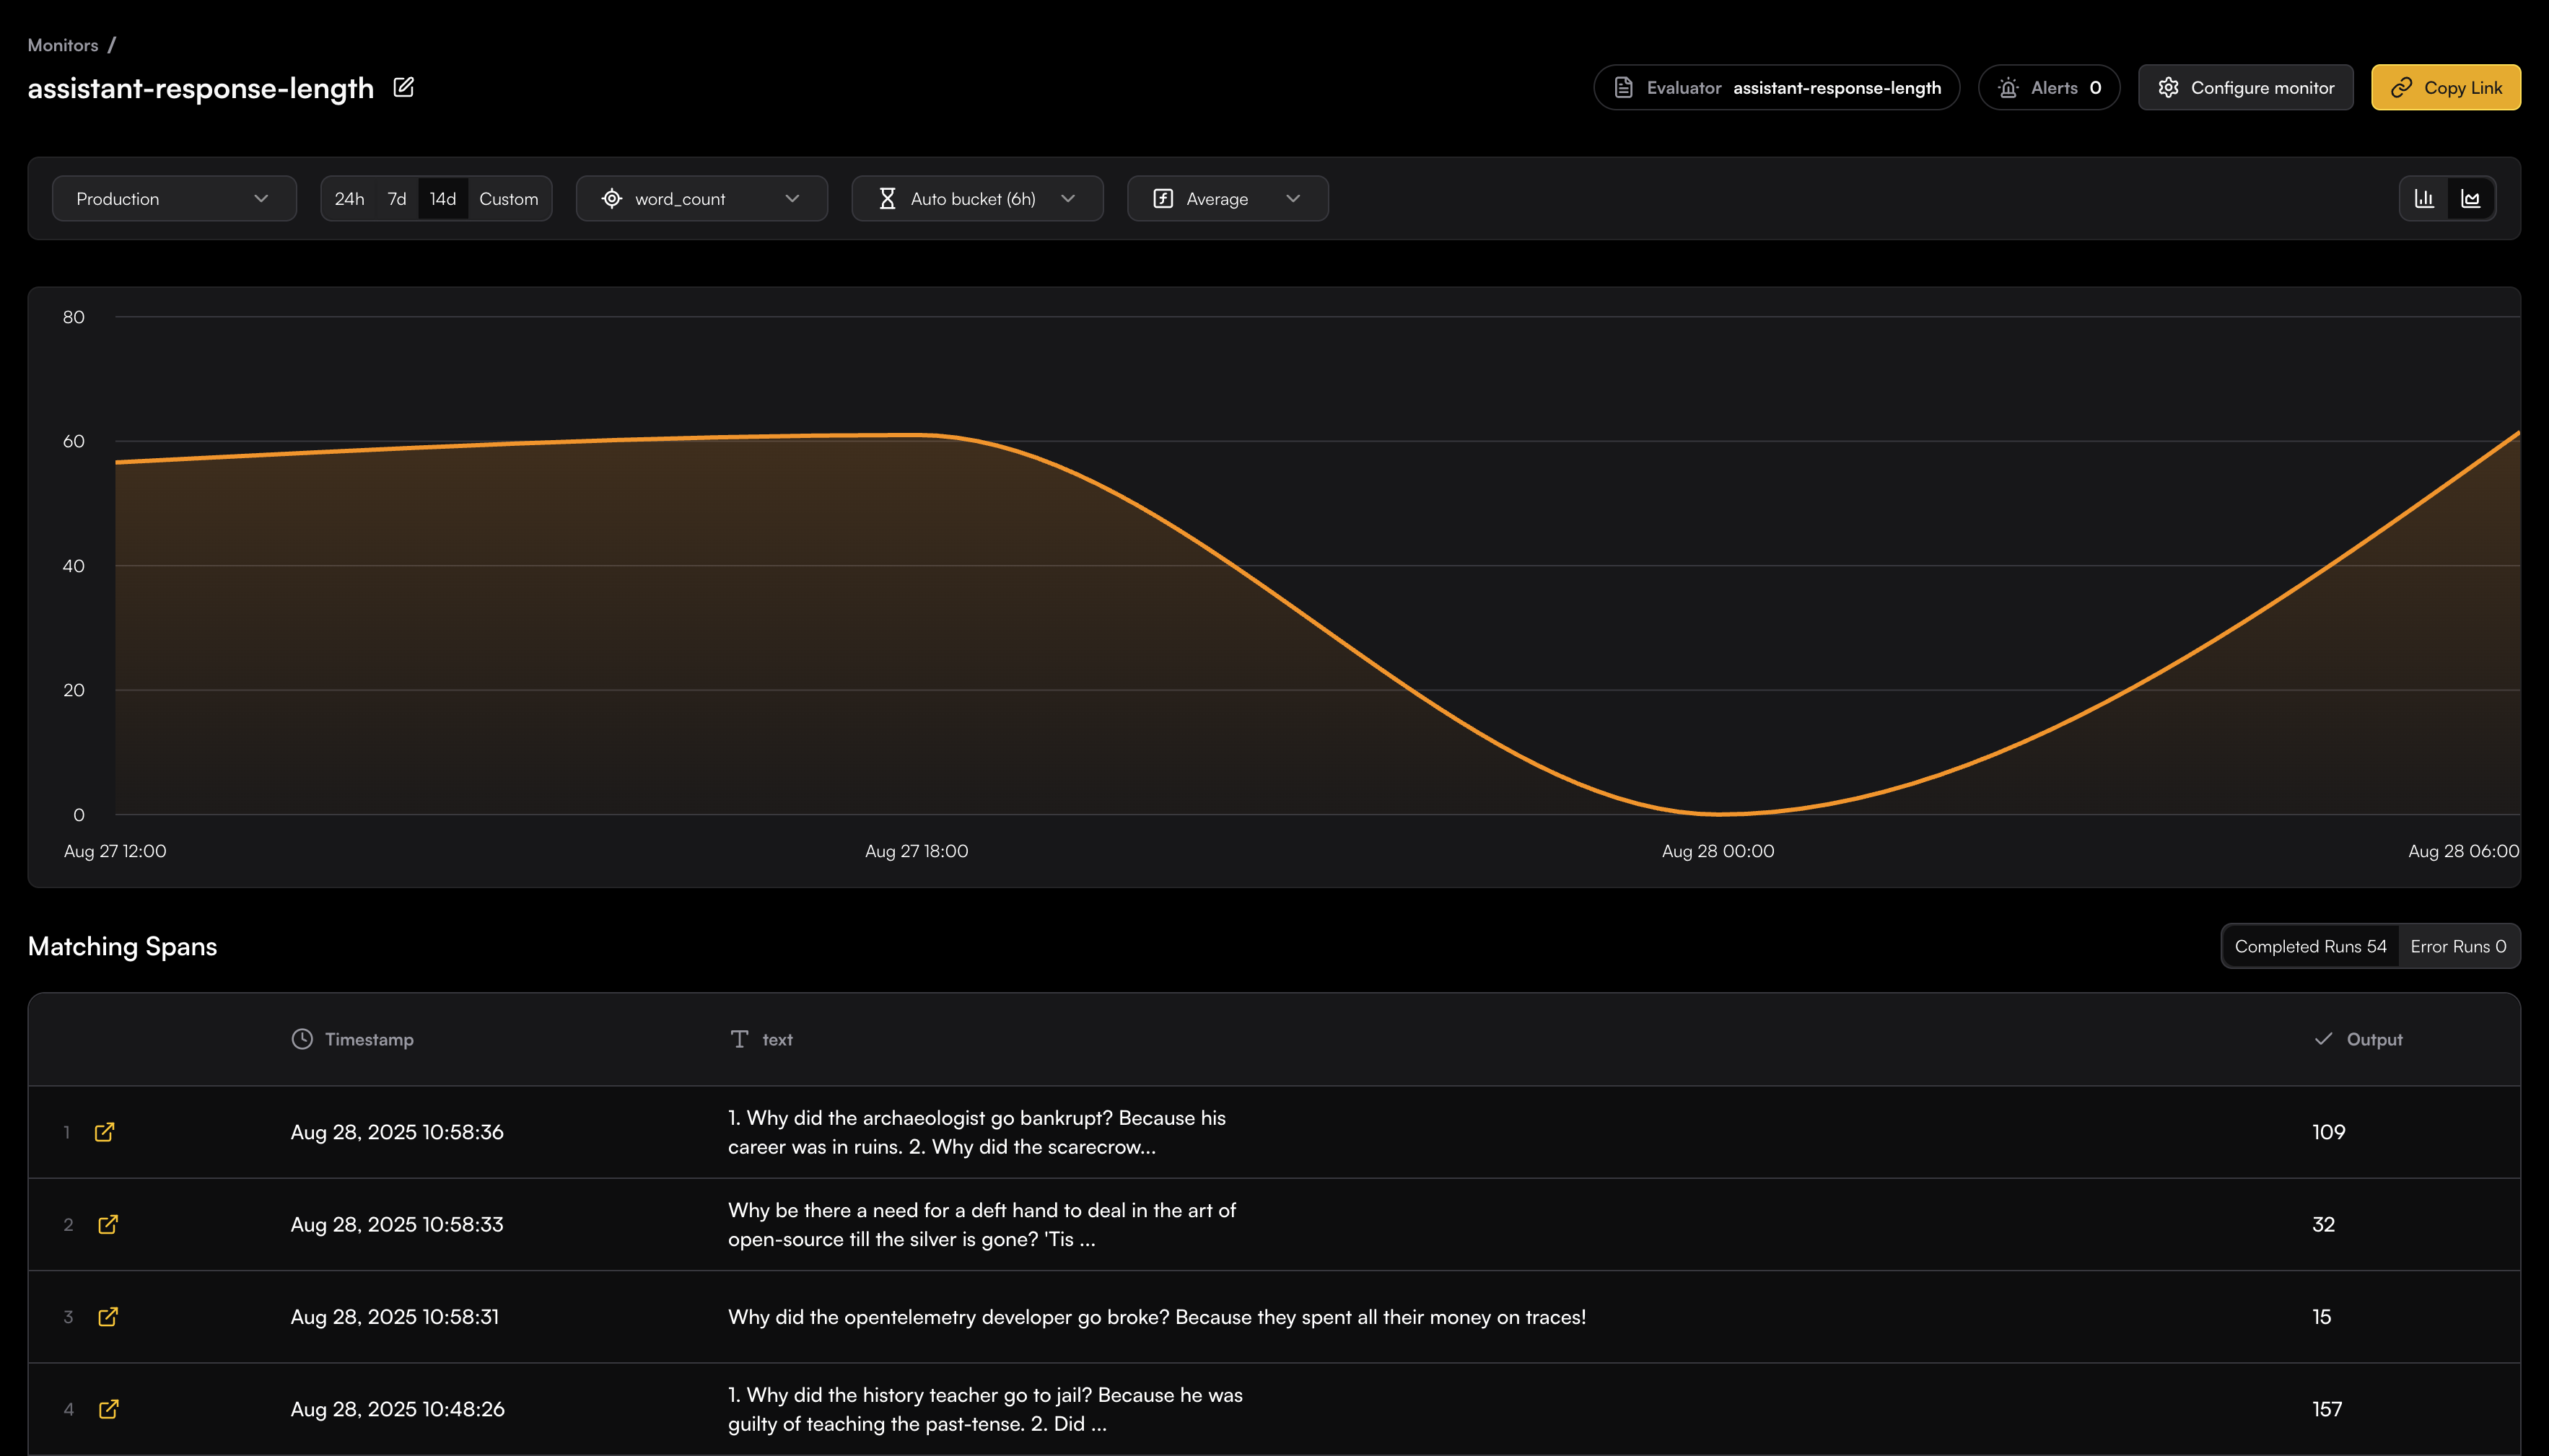
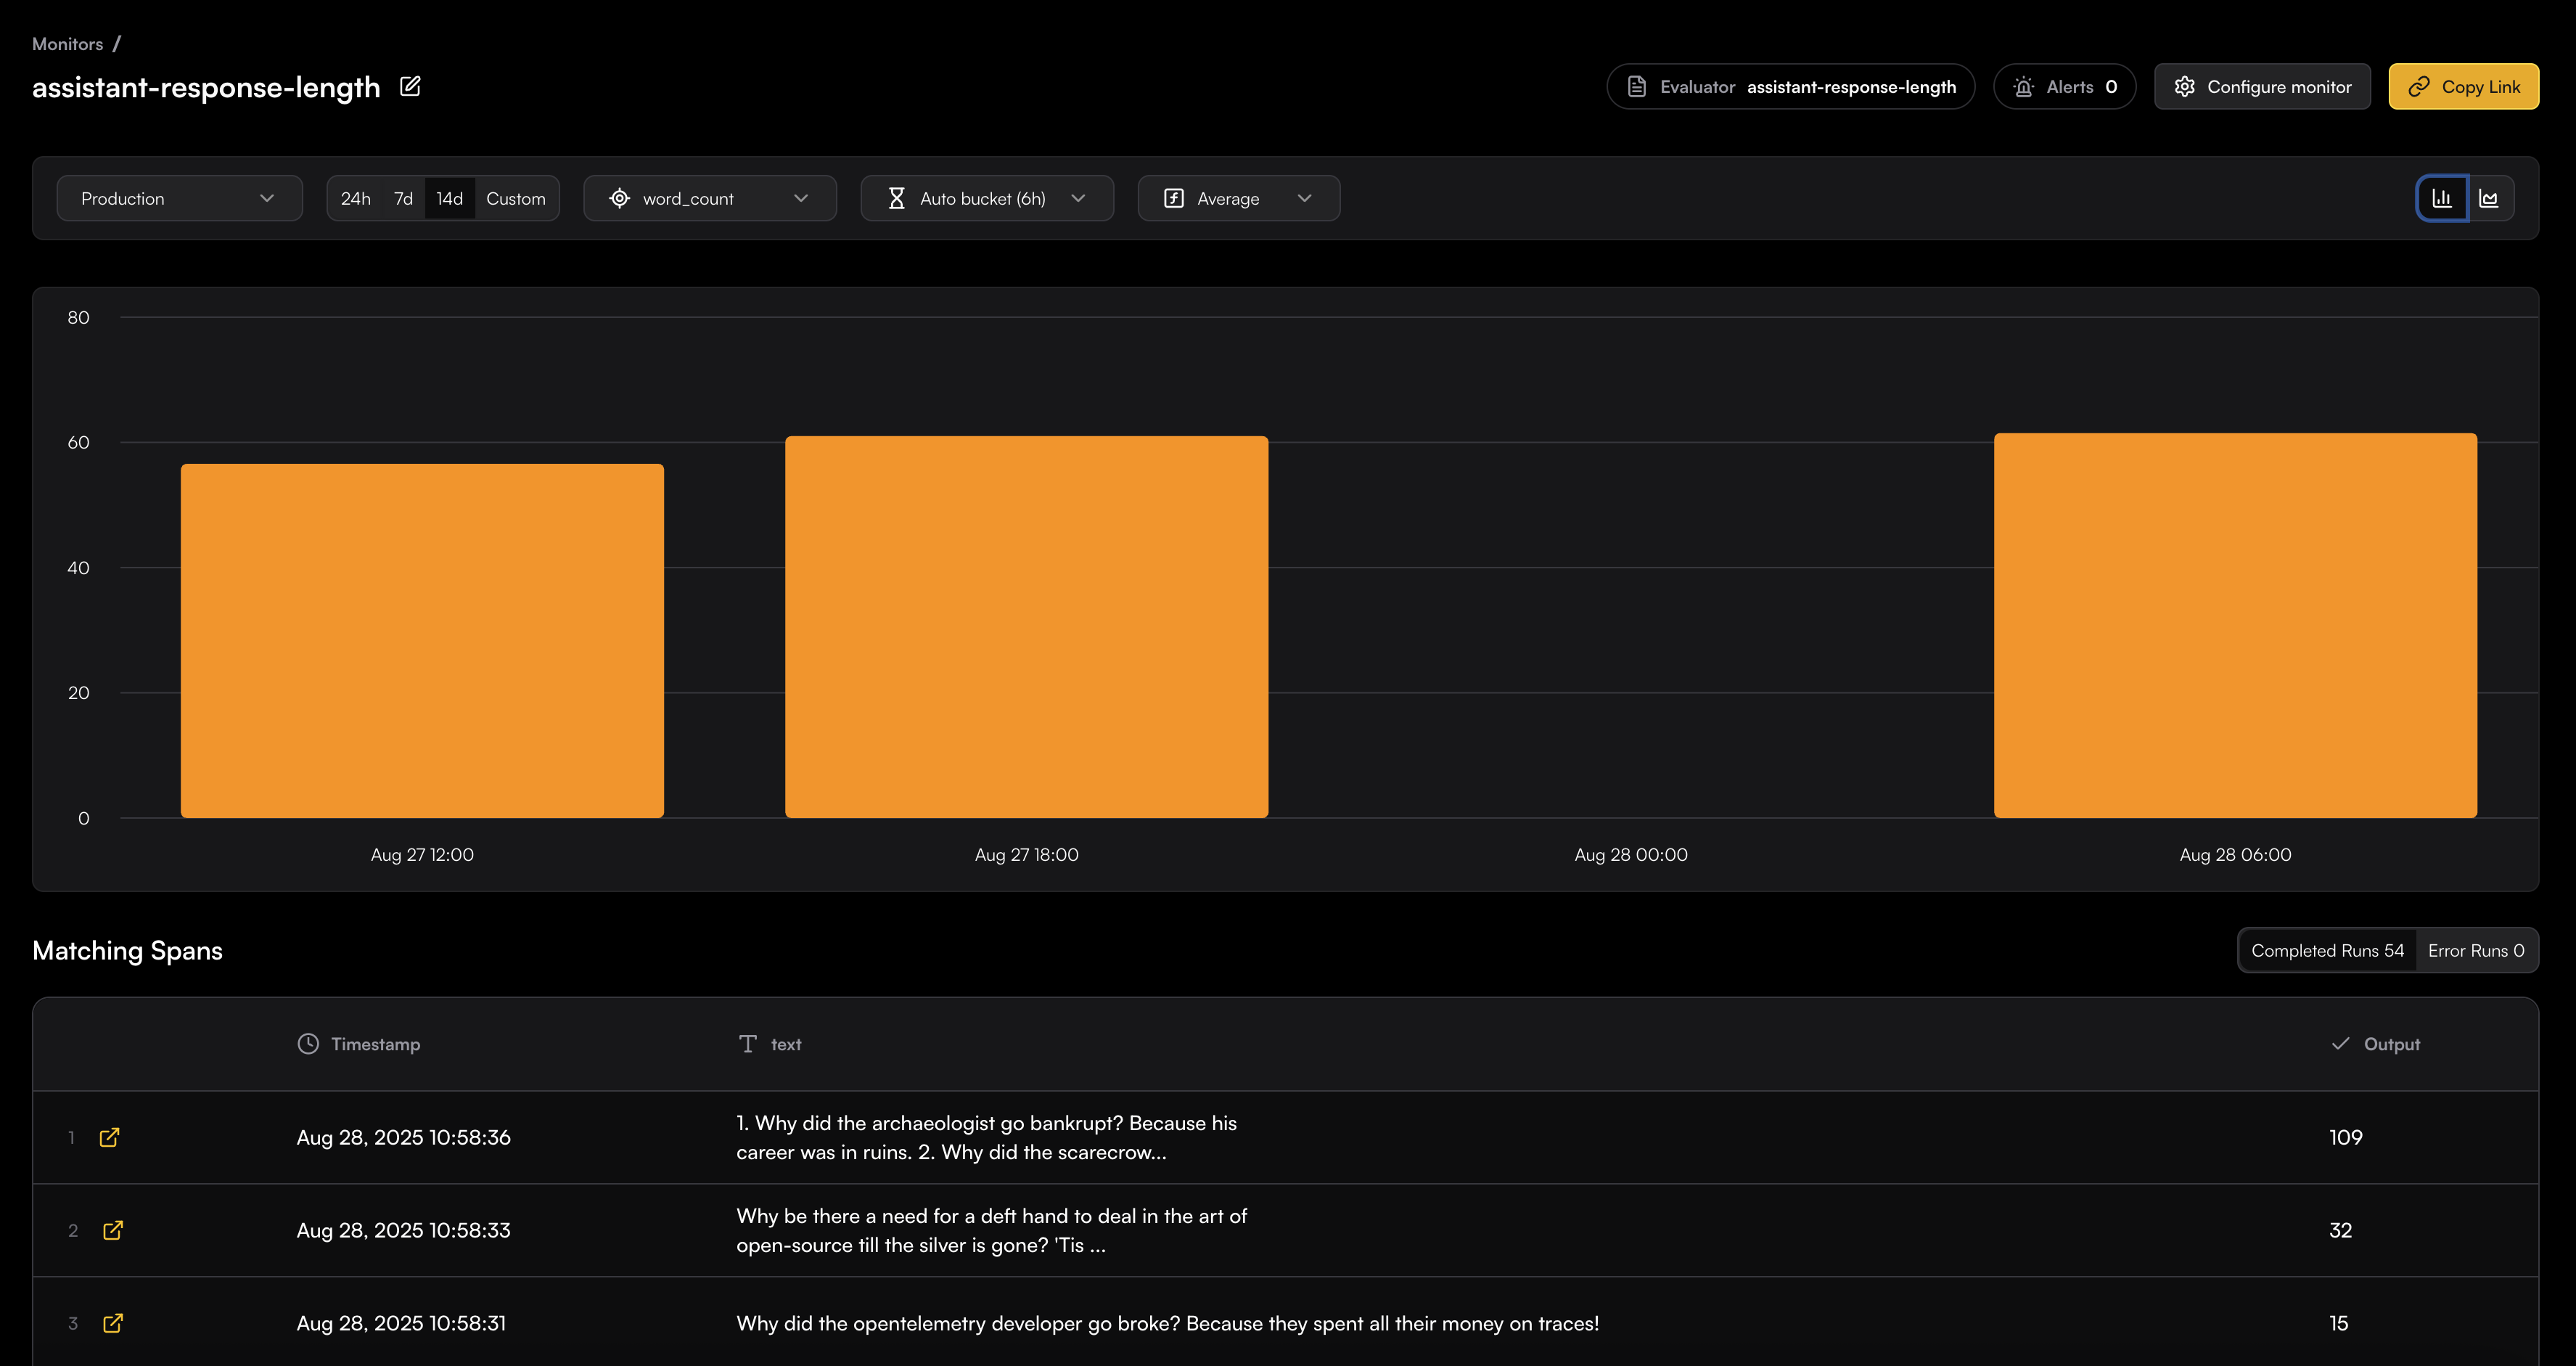 #### Filtering and Time Controls
The top toolbar provides filtering options:
* **Environment**: Filter by production, staging, etc.
* **Time Range**: 24h, 7d, 14d, or custom ranges
* **Metric**: Select which evaluator output property to measure
* **Bucket Size**: 6h, Hourly, Daily, etc.
* **Aggregation**: Choose average, median, sum, min, max, or count
#### Matching Spans Table
The bottom section shows all spans that matched your monitor's filter criteria:
* **Timestamp**: When the evaluation occurred
* **Input**: The actual content that was mapped to be evaluated
* **Output**: The evaluation result/score
* **Completed Runs**: Total successful/error evaluations
* **Error Runs**: Failed evaluation attempts
Each row includes a link icon to view the full span details in the trace explorer:
#### Filtering and Time Controls
The top toolbar provides filtering options:
* **Environment**: Filter by production, staging, etc.
* **Time Range**: 24h, 7d, 14d, or custom ranges
* **Metric**: Select which evaluator output property to measure
* **Bucket Size**: 6h, Hourly, Daily, etc.
* **Aggregation**: Choose average, median, sum, min, max, or count
#### Matching Spans Table
The bottom section shows all spans that matched your monitor's filter criteria:
* **Timestamp**: When the evaluation occurred
* **Input**: The actual content that was mapped to be evaluated
* **Output**: The evaluation result/score
* **Completed Runs**: Total successful/error evaluations
* **Error Runs**: Failed evaluation attempts
Each row includes a link icon to view the full span details in the trace explorer:
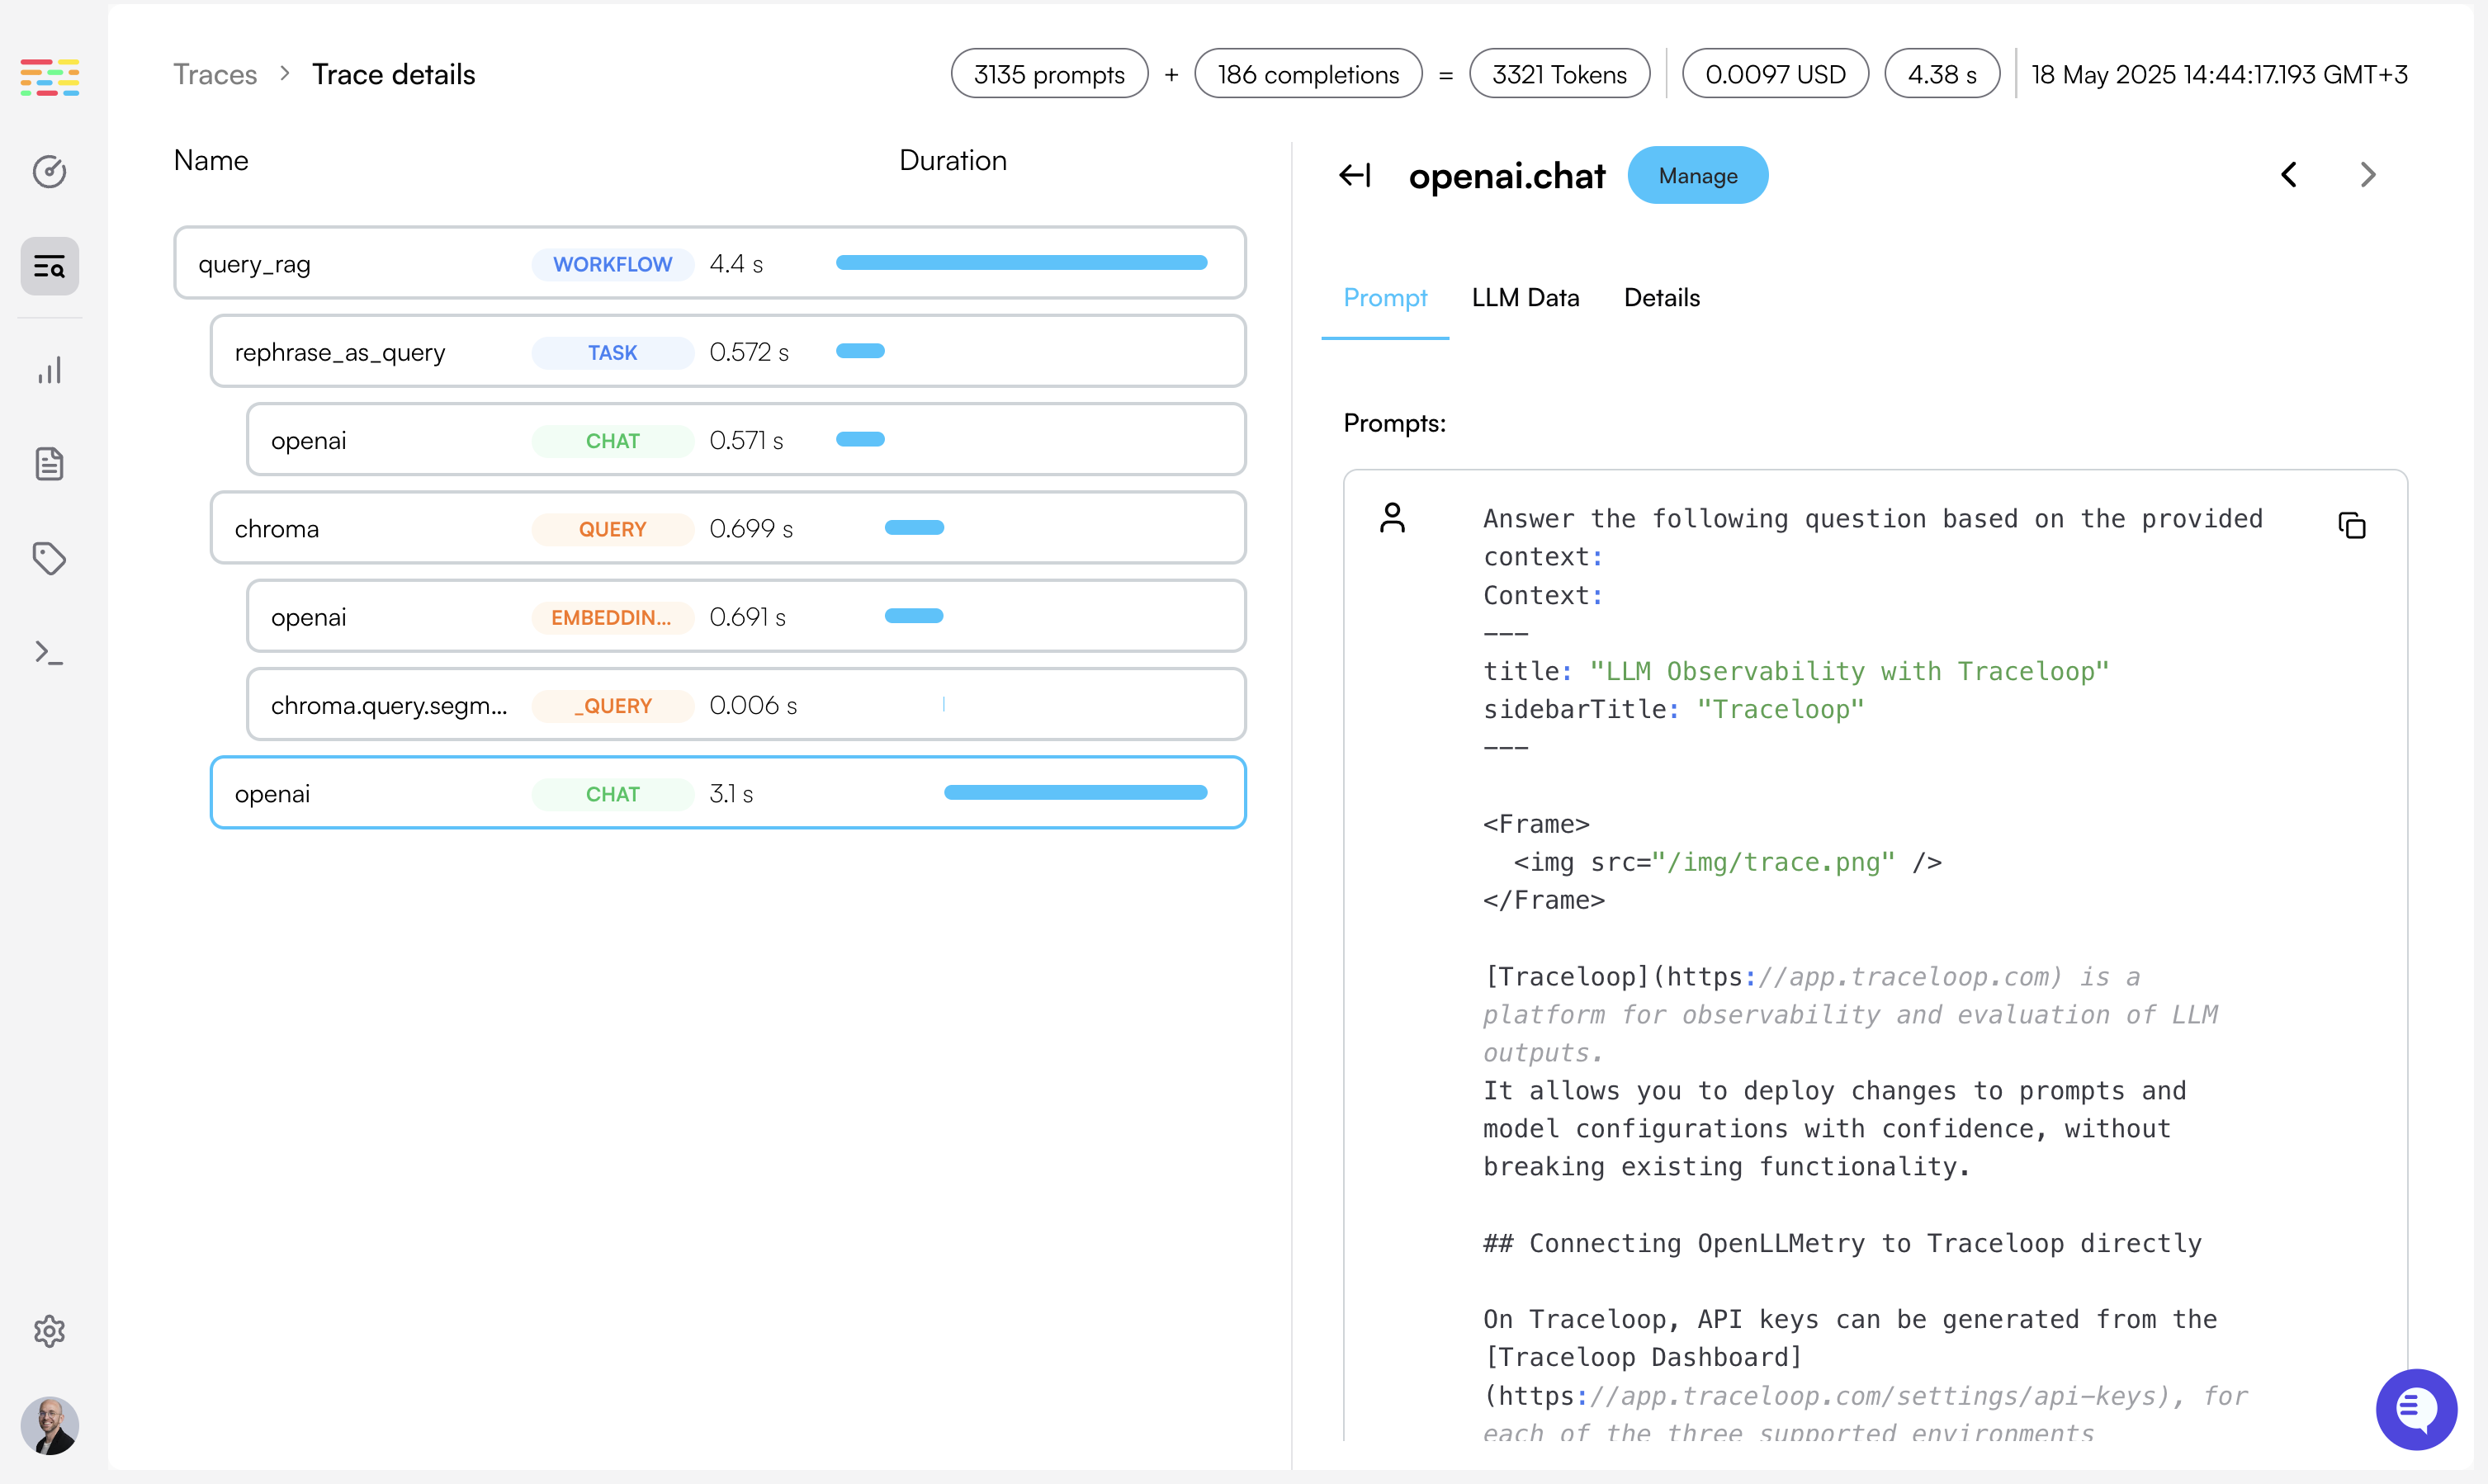
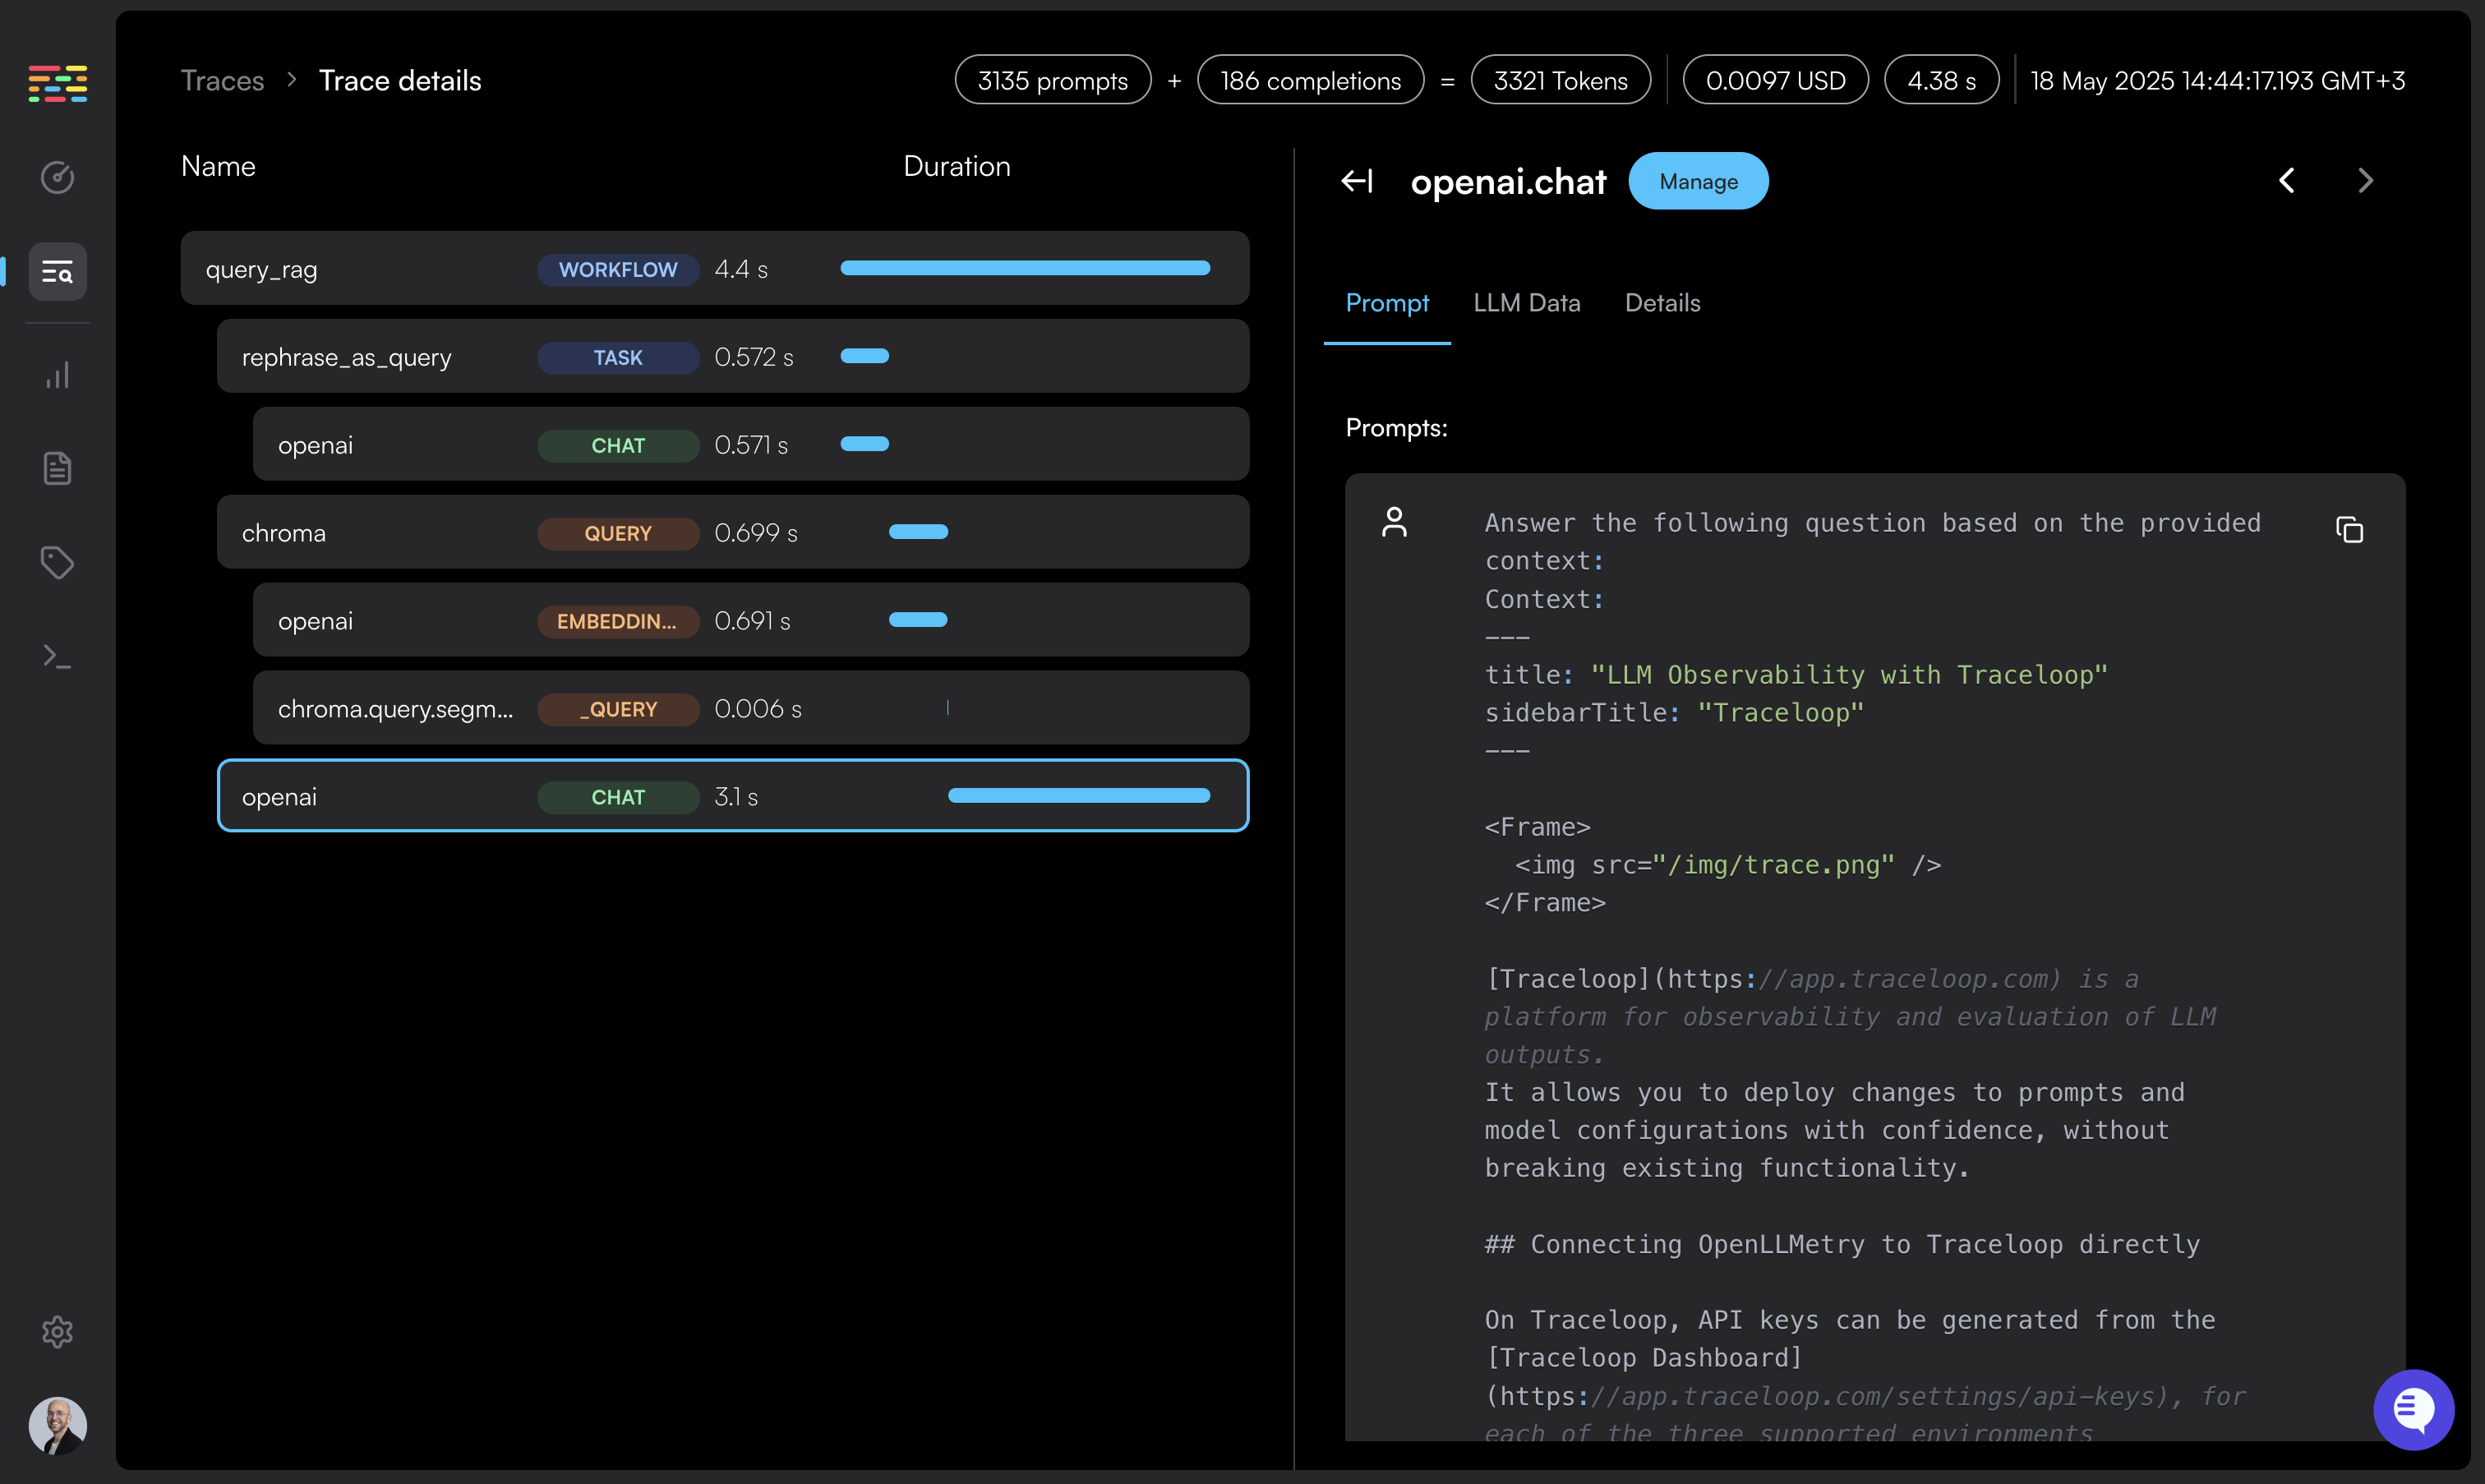 For further information on tracing refer to [OpenLLMetry](/openllmetry/introduction).
Ready to set up an evaluator for your monitor? Learn more about creating and configuring evaluators in the [Evaluators](/evaluators/intro) section.
For further information on tracing refer to [OpenLLMetry](/openllmetry/introduction).
Ready to set up an evaluator for your monitor? Learn more about creating and configuring evaluators in the [Evaluators](/evaluators/intro) section.